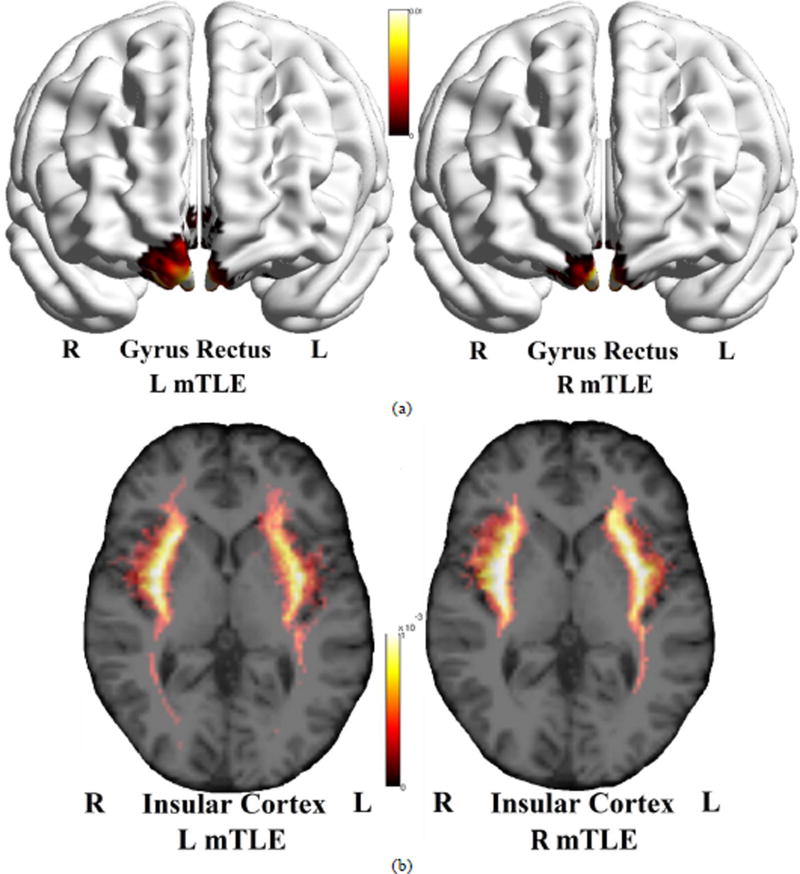
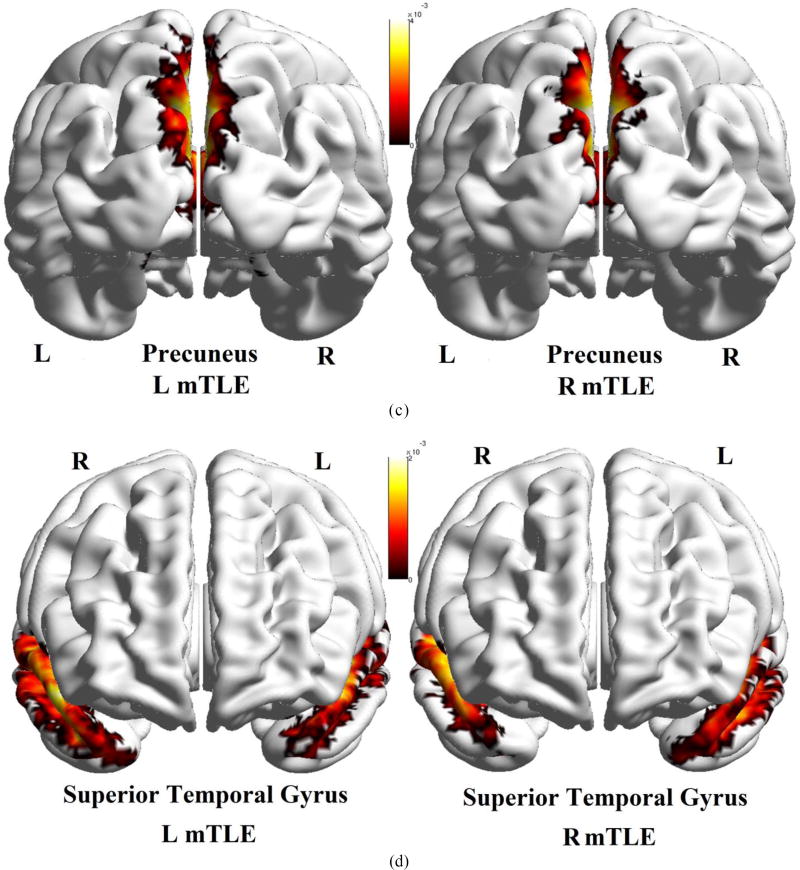
Figure 11.
Averaged density map of tracts overlaid upon the MNI registered brain, between the gyrus rectus (a), insular cortex (b), precuneus (c) and the superior temporal gyrus (d) as the input ROI and all other anatomical ROIs. The density maps are averaged on the left mTLE patients (left images) as well as right mTLE patients (right images). Note that in (b), the tracts originating from the insular cortex are deep intracranial tracts and cannot be rendered on the surface of the MNI registered brain.


