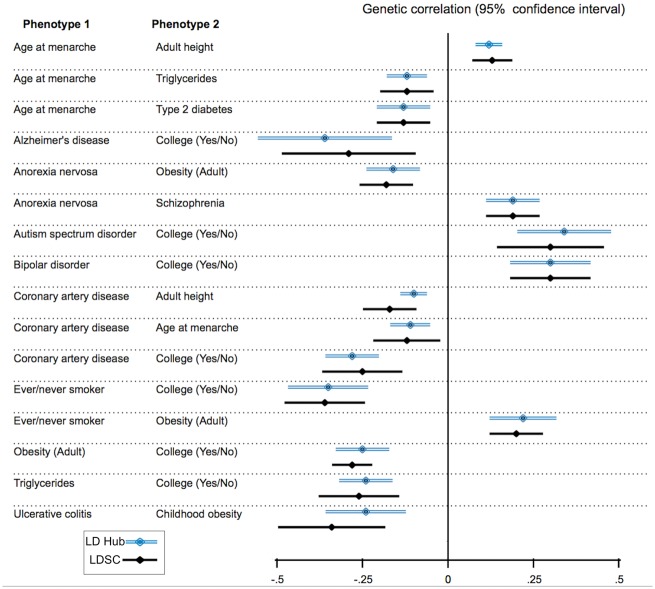
Fig 4.
Comparison of genetic correlation results between LD Hub and previously reported LD score regression results. Double blue lines represent genetic correlation results from LD Hub, and the black single lines represent genetic correlation results from previously reported LD score regression results. The discrepancies can be attributed to the minor changes in the quality control processes and the replacement of some GWAS results with more recent versions

