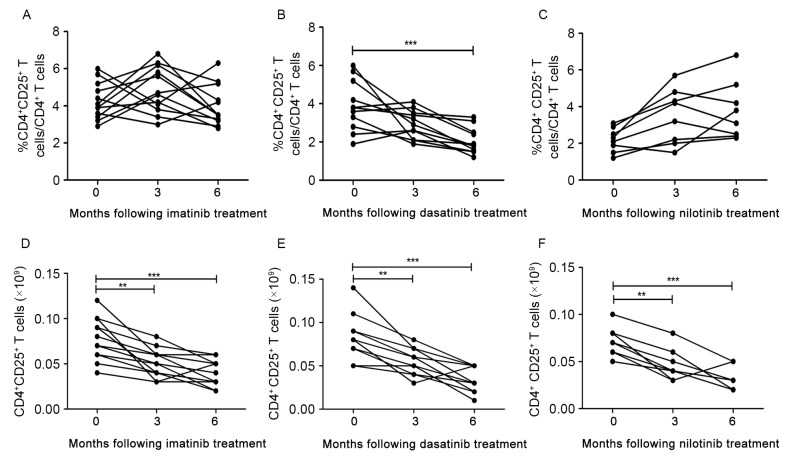
Figure 2.
Analysis of CD4+CD25+ T cells from peripheral blood of patients with chronic myeloid leukemia at diagnosis and during treatment with tyrosine kinase inhibitors. Percentage of CD4+CD25+T cells in (A) imatinib, (B) dasatinib and (C) nilotinib. Absolute numbers of CD4+CD25+T cells in (D) imatinib, (E) dasatinib and (F) nilotinib treatment groups. CD, cluster of differentiation. *P<0.05, **P<0.01 and ***P<0.0001.

