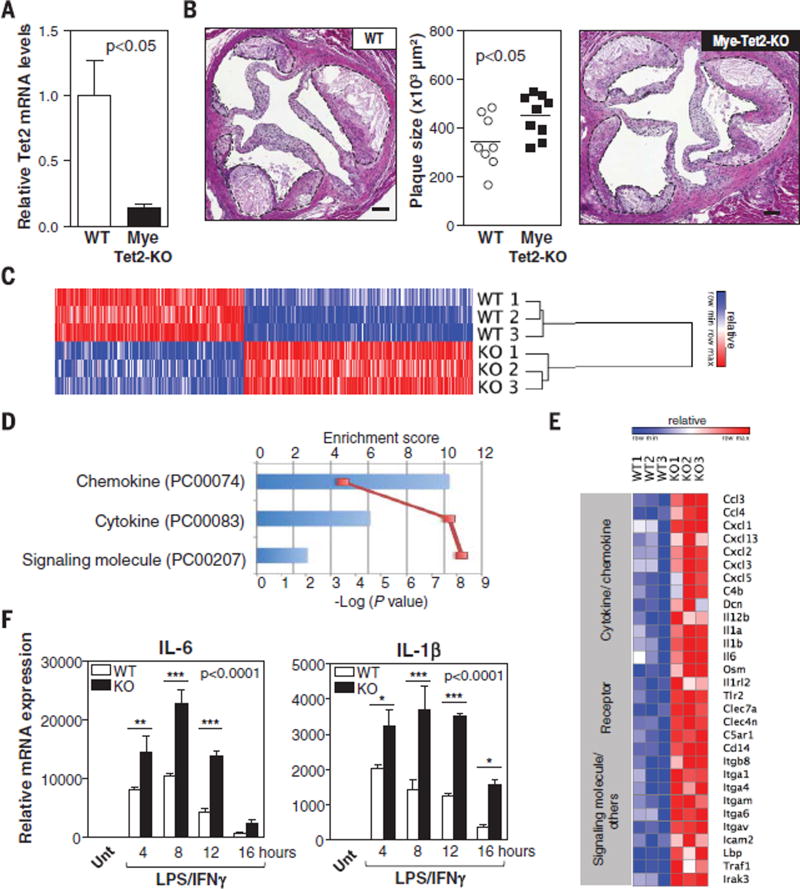
Fig. 2. TET2 deficiency in macrophages promotes inflammation and aggravates atherosclerosis.
(A and B) Ldlr−/− Mye-Tet2-KO mice (LysM-Cre+ Tet2flox/flox BMT) and WT controls (LysM-Cre− Tet2flox/flox BMT) were fed a HFHC diet for 10 weeks. (A) qRT-PCR analysis of TET2 transcript levels in BM-derived macrophages isolated from Mye-Tet2-KO mice and WT controls (n = 6 mice per genotype). (B) Aortic root plaque size. Representative images of H&E-stained sections are shown; atherosclerotic plaques are delineated by dashed lines. Scale bars, 100 µm. (C to F) Peritoneal macrophages were isolated from Tet2−/− mice or WT controls [n = 3 mice per genotype in (C) to (E); n = 4 mice per genotype in (F)] and treated with 10 ng/ml LPS and 2 ng/ml IFN-γ to induce proinflammatory activation. (C) Heat map of genes with expression change exceeding a factor of 1.5 (q < 0.05) after 10 hours of LPS/IFN-γ stimulation, from a genome-wide expression profiling by microarray. (D) PANTHER analysis of genome-wide expression profiling by microarray. Three overrepresented classes were identified in Tet2−/− macrophages compared with all genes in Mus musculus (Bonferroni correction P < 0.05). (E) Heat map of selected genes up-regulated in Tet2−/− macrophages with expression change exceeding a factor of 1.5 (q < 0.05) from the genome-wide expression profiling by microarray. (F) qRT-PCR analysis of transcript levels of proinflammatory cytokines (IL-6 and IL-1β). Unt, untreated. Statistical significance was evaluated by two-tailed unpaired Student’s t test with Welsh’s correction (A), by two-tailed unpaired Student’s t test (B), and by two-way ANOVA (P value for effect of genotype shown in graph) with Sidak multiple comparison tests (*P < 0.05, **P < 0.01, ***P < 0.001) (F). Error bars indicate SEM.

