
Figure 2. CTCF ZF3-7 forms base-specific contacts.
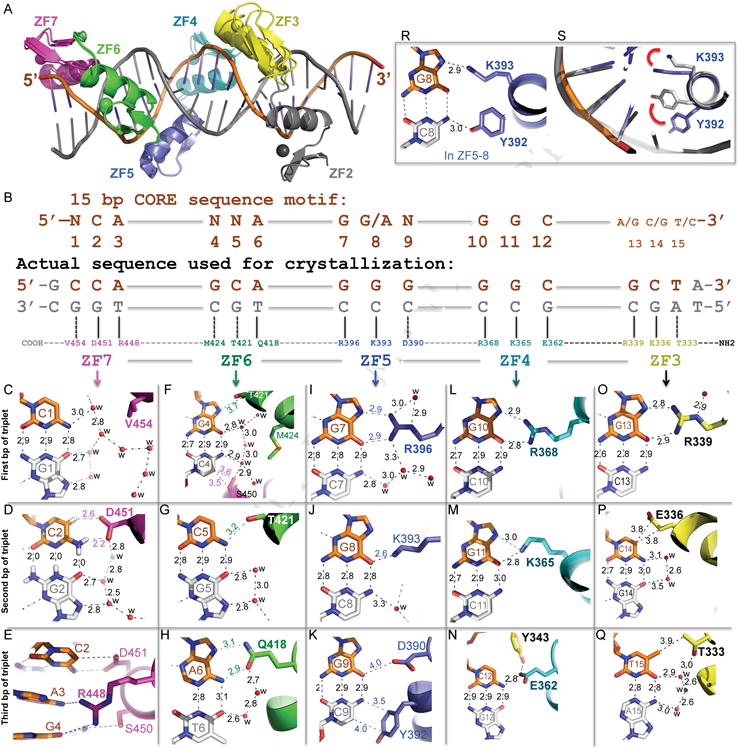
(A) Structural superimposition of ZF2-7 and ZF3-7.
(B) Schematic representation of the ZF3–7 interactions with DNA. The top line indicates the 15-bp consensus sequence. The second line indicates the base pair positions (1–15). The third and the fourth lines are the sequence of the double-stranded oligo used for crystallization, shown with the top strand (orange) matching the consensus sequence. Amino acids of each finger interact specifically with the DNA bases shown below.
(C-Q) DNA base specific interactions involve a particular residue of each ZF, colored according to panel A. Atoms are colored dark blue for nitrogen, red for oxygen, and carbon atoms are decorated with finger specific colors. The numerical numbers indicate the inter-atomic distance in angstroms, ‘w’ is water molecules (small red spheres). Note in panel D, hydrogen atoms on the G2:C2 base pair were shown to illustrate the C-H…O type of hydrogen bonds between C2 ring carbon atom C5-H and D451.
(R) In the structure of ZF5-8, side chains of Y392 and K393 interact respectively with the cytosine and guanine of the C8:G8 base pair.
(S) Side chains of Y392 and K393 in the structure of ZF5-8 (grey) adopted different conformations from that of ZF3-7 (blue; as shown in panel J). The red arrows indicate a concerted movement of the two side chains.