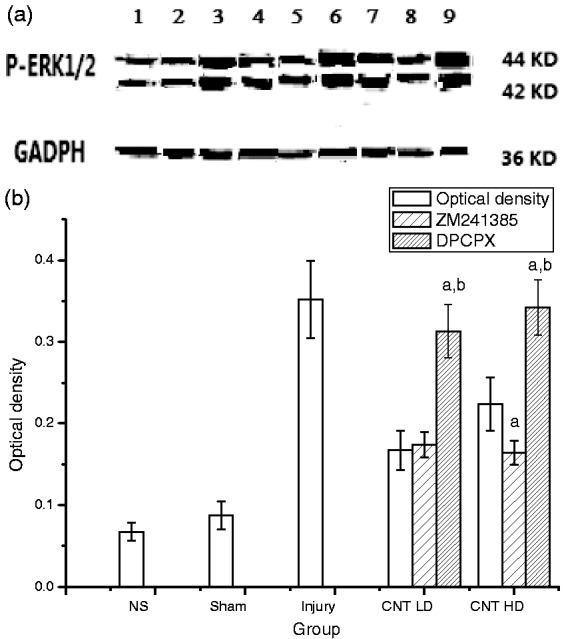
Figure 3.

Expression of p-ERK 1/2 in corpus striatum of mice with spinal cord injury. (a) Western blotting, (b) optical density of the bands. Lanes 1 to 9 represent the groups of normal saline (NS), sham, compression injury, CNT LD (25 µg/kg), CNT LD+ZM241385, CNT LD+DPCPX, CNT HD (100 µg/kg), CNT HD+ZM241385, CNT HD+DPCPX, respectively. Data were represented as , n = 8. a, p < 0.05, compared with CNT group in corresponding dose; b, p < 0.05, compared with the group of ZM241385 in corresponding CNT dose.
