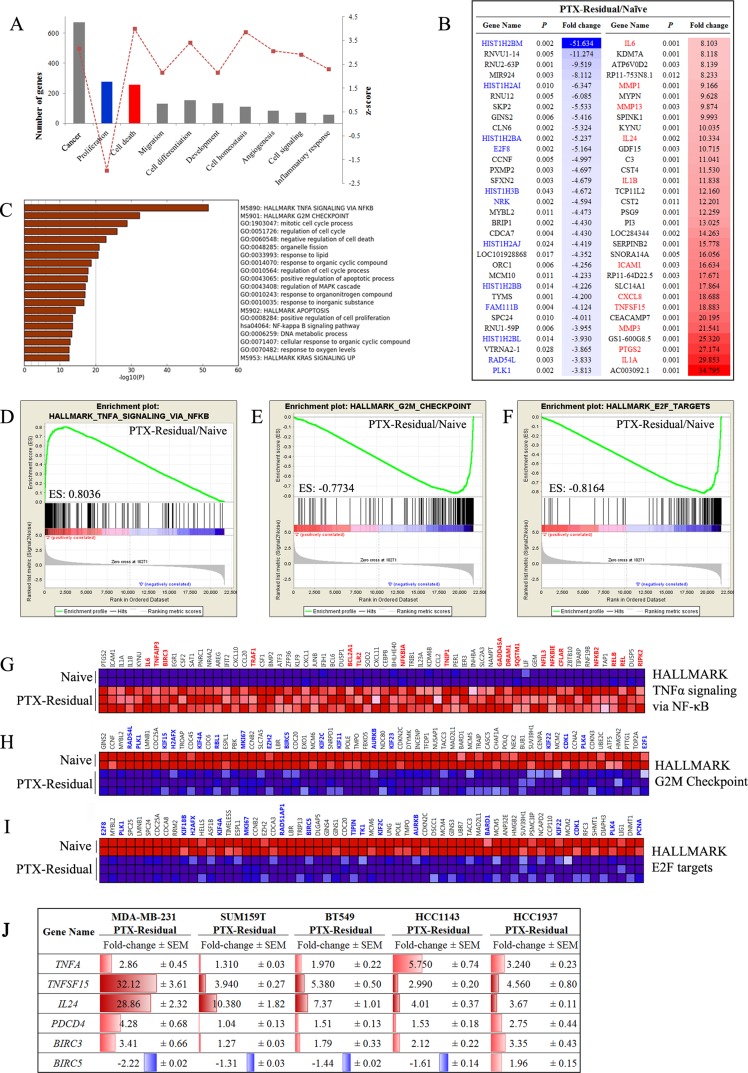
Figure 4. Gene expression analysis of paclitaxel-residual MDA-MB-231 cells.
(A) Most significantly affected biological processes according to Ingenuity Pathway Analysis in PTX-residual MDA-MB-231 compared to the parental naïve cells. (B) List of top 30 significantly down- and up-regulated genes in the paclitaxel-residual group (Partek Genomics Suite). The fold change values are given as linear ratios of the respective gene expression values. Significantly downregulated or upregulated genes implicated in cell cycle-related processes or cell-death/stress response are highlighted in blue or red, respectively. (C) Pathway enrichment analysis (Metascape server) of the IPA apoptosis-related genelist. The most enriched pathway is the Hallmark TNFα signaling via NFκB, whereas the cell cycle-related pathways are negatively enriched. (D–F) Enrichment plots (GSEA) of the Hallmark genesets related with TNFα/NFκB signaling (D), G2M mitotic checkpoint (E) and E2F targets (F). (G) Heatmap of the significantly enriched genes of the HALLMARK TNFa signaling via NFkB geneset (GSEA). Genes that are implicated in the response to SMAC or BH3 mimetics are highlighted with red. Heatmaps of the negatively enriched (H) Hallmark G2M Checkpoint geneset and (I) Hallmark E2F targets (GSEA). Important genes (e.g. BIRC5, E2F1, AURKB, PLK1, various kinesins) are highlighted with blue. (J) qRT-PCR analysis of the indicated genes in the indicated paclitaxel-residual TNBC cell lines and their corresponding parental cells was used to calculate the relative gene expression levels. The results are presented as fold change of expression in paclitaxel-residual cells compare to parental cells. The mean values ± SEM from three independent experiments are shown. Increase in gene expression is highlighted in red and decrease in blue.

