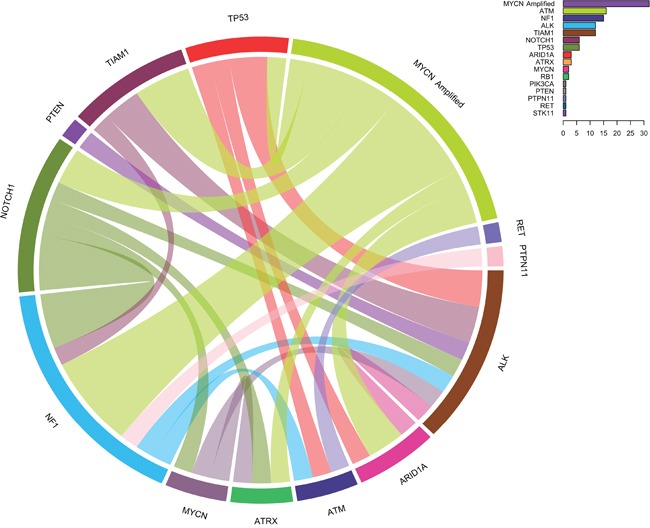
Figure 3. Circos diagram showing concomitantly mutated genes and/or MYCN amplification.

The diagram represents paired concomitant genetic alterations found in 106 primary neuroblastomas using NB-panel. Frequencies of all variants are indicated in the chart on the upper right corner.
