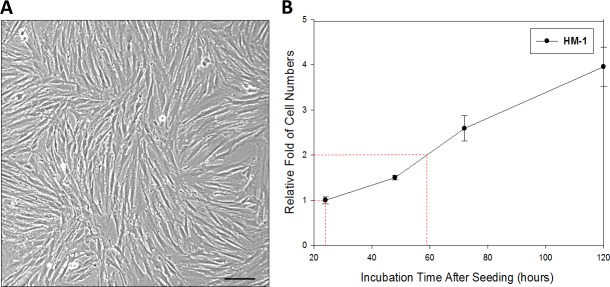
Figure 1. Characterization of HM-1 cells.
(A) Morphological presentation of HM-1 cell culture. (Scale bar represented 100 μm) (B) Cell growth curve assay was performed in 6-cm petri dish; 1 × 10⁵ HM-1 cells were seeded and counted every 24 hours. The HM-1 cell population was estimated to double every 35 hours. The data represented the mean ± SEM.

