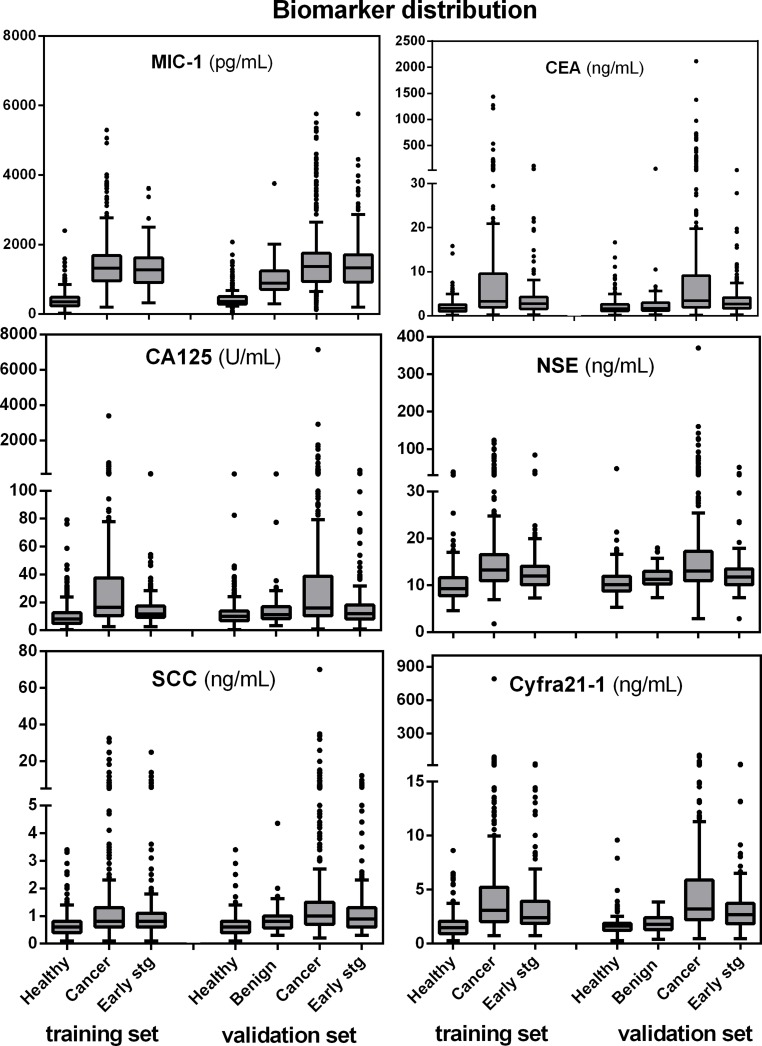
Figure 1. Boxplot display of biomarker distributions for controls, lung cancer cases, the subset of early stage (I and II) cases and benign conditions, by training and validation set assignment.
Horizontal box boundaries and midline denote sample quartiles. Whiskers mark *adjacent values: upper adjacent value = largest marker value x such that x < = 75th percentile + 1.5 * interquartile distance. Similarly, lower adjacent value = lowest marker value such that x > = 25th percentile -1.5 * interquartile distance. The interquartile distance (IQR) = 75th–25th percentile.

