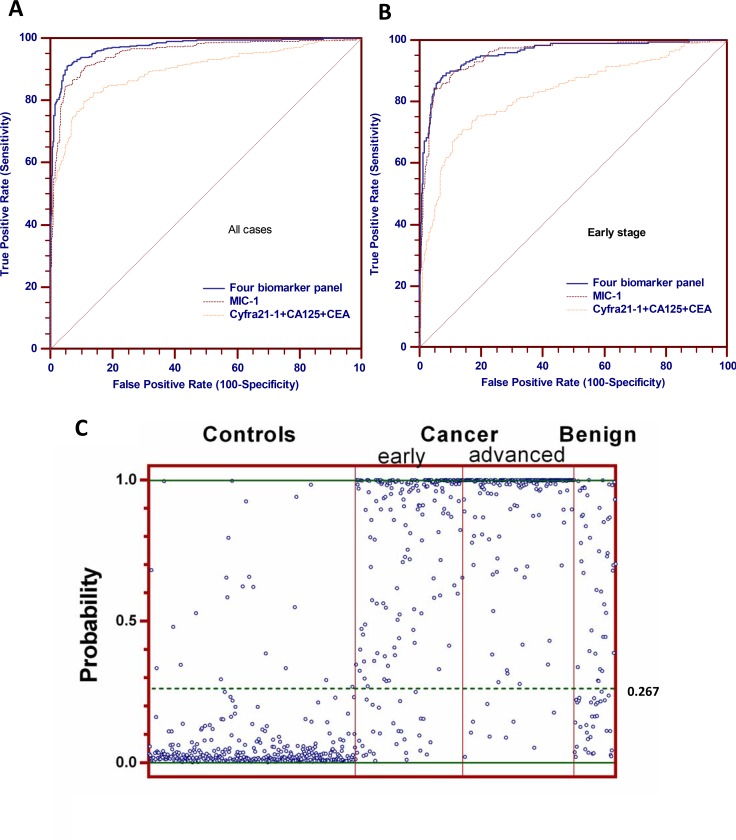
Figure 4. Performance of the four biomarkers panel (MIC-1, Cyfra21-1, CA125 and CEA) in the validation group.
(A) ROC curves of four biomarker panel, MIC-1 alone and Cyfra21-1, CA125, CEA combination for all lung cancer cases in the validation group. (B) ROC curves of four biomarker panel, MIC-1 alone and Cyfra21-1, CA125, CEA combination for early-stage lung cancer cases in the validation group. (C) scatterplot of the model predicted disease probabilities by disease group for subjects in the validation group.

