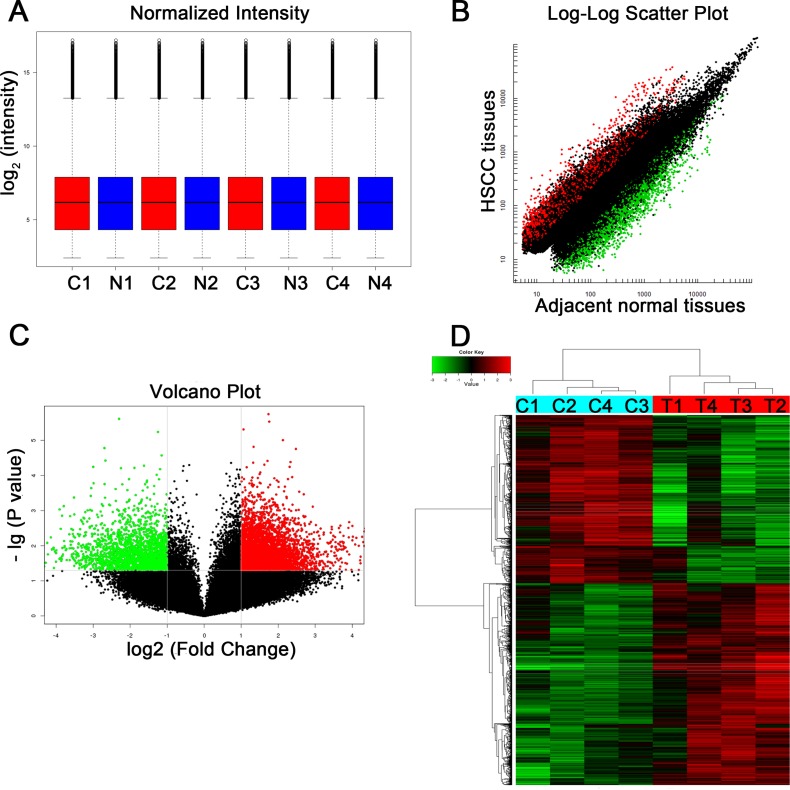
Figure 1. Different expression profiles of circRNAs in HSCC tissues versus adjacent normal tissues.
(A) A box plot for visualizing the distributions of normalized intensities in samples. (B) A scatter plot for revealing the difference in circRNA expression between HSCC tissue and adjacent normal tissues. (Red points stand for upregulated circRNAs with FC ≥ 2.0 in HSCC tissues and green points represent downregulated circRNAs) (C) A volcano plot showing significantly dysregulated circRNAs in HSCC tissues. (Red or green points represent upregulated or downregulated circRNAs in HSCC tissues, respectively (FC ≥ 2.0, P value < 0.05), respectively.) (D) Heat map and hierarchical clustering analysis revealed different circRNA expression profiles between HSCC tissues and adjacent normal tissues. Hierarchical clustering analysis for 8 samples in the tumor group (C1, C2, C3, and C4) and non-tumor group (T1, T2, T3, and T4).

