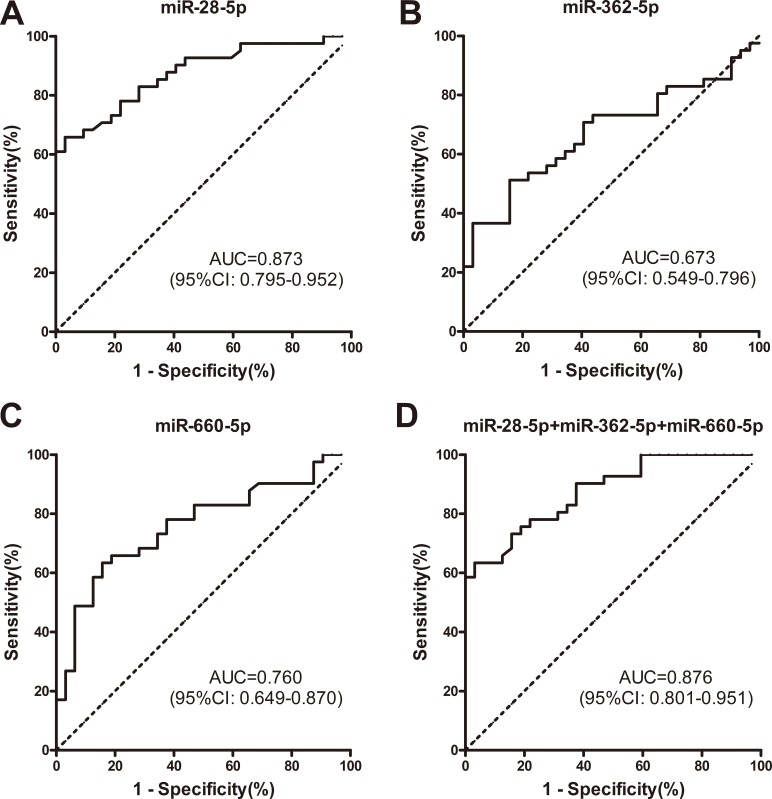
Figure 5. ROC curve analyses demonstrated that plasma levels of miR-28-5p, miR-362-5p, and miR-660-5p differed between patients with ALK-positive and ALK-negative NSCLC.
(A–C) ROC curves showing that plasma levels of miR-28-5p, miR-362-5p, and miR-660-5p differ between patients with ALK-positive and ALK-negative NSCLC. (D) Combination ROC curve analyses of the 3 microRNAs as a means of distinguishing between patients with ALK-positive and ALK-negative NSCLC. ALK, anaplastic lymphoma kinase; AUC, area under the curve; NSCLC, non-small cell lung cancer; ROC, receiver operating characteristic curve.

