
Figure 1. Effect of anti-EGFR monoclonal antibody treatment on EGFR surface expression levels.
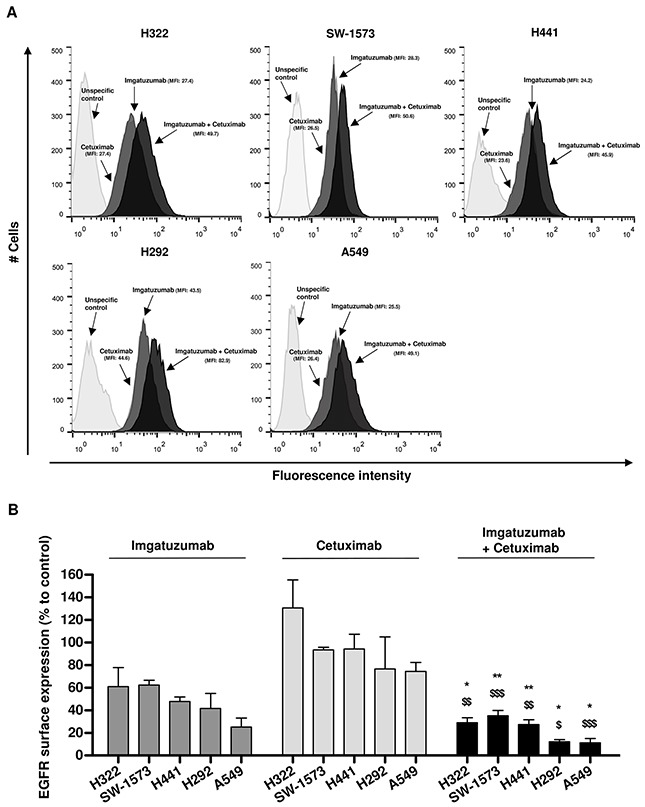
(A) Flow cytometric analysis of imgatuzumab and cetuximab binding alone or in combination in H322, SW-1573, H441, H292 and A549 cells. (B) H322, SW-1573, H292, H441 and A549 cells were treated with the anti-EGFR monoclonal antibodies (20 μg/mL total) for 72 hours. Surface expression levels were determined using flow cytometry. The surface expression in untreated control cells was set at 100% both for the single antibodies and the combination. (*P < 0.05, **P < 0.01 combination vs imgatuzumab; $P < 0.05, $$P < 0.01, $$$P < 0.001 combination vs cetuximab; unpaired t-test). Data points are mean + SD (n = 3).