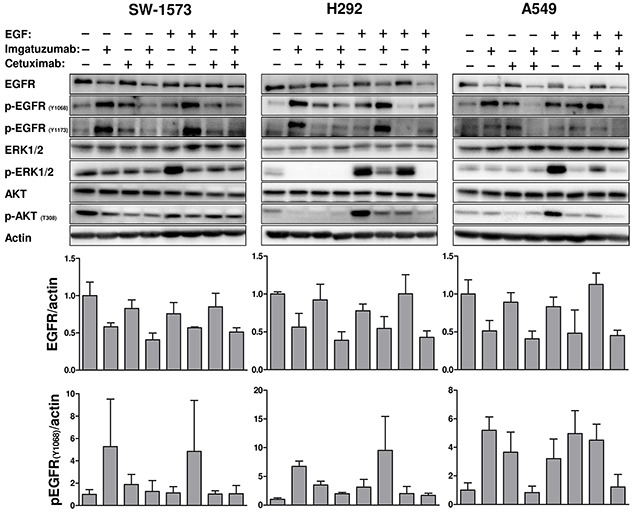
Figure 2. Western blot analysis of the effect of 24 hours anti-EGFR monoclonal antibody treatment on EGFR total protein levels and downstream signaling under normal growth conditions or 15 min EGF stimulation (10 ng/mL).

The immunoreactive spots were quantified by densitometric analysis and normalized using actin (see also Supplementary Figure 2). Values are expressed as fold increase versus control + SD. All experiments were performed in triplicate.
