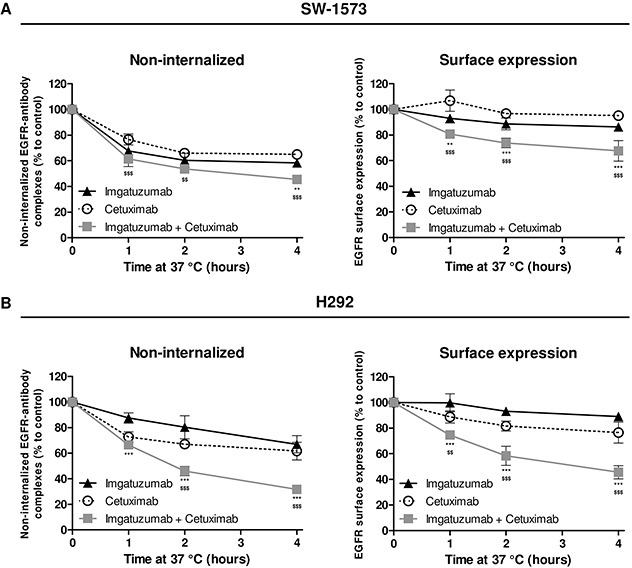
Figure 3. Influence of monoclonal antibody binding on EGFR internalization and surface expression.

SW-1573 (A) and H292 cells (B) were surface labeled with the anti-EGFR monoclonal antibodies on ice and incubated at 37°C for the indicated times, and then analyzed for the non-internalized EGFR-antibody complexes (left) and cell surface expression (right). The lower the amount of non-internalized EGFR-antibody complexes, the higher the amount of internalized antibody-EGFR complexes. The surface expression at t=0 was set at 100%. The non-internalized and surface expression were determined as described in Materials and Methods (n=3). Data points are mean ± SD. (**P < 0.01, ***P < 0.001 combination vs imgatuzumab; $$P < 0.01, $$$P < 0.001 combination vs cetuximab; two-way ANOVA followed by Bonferroni post-test).
