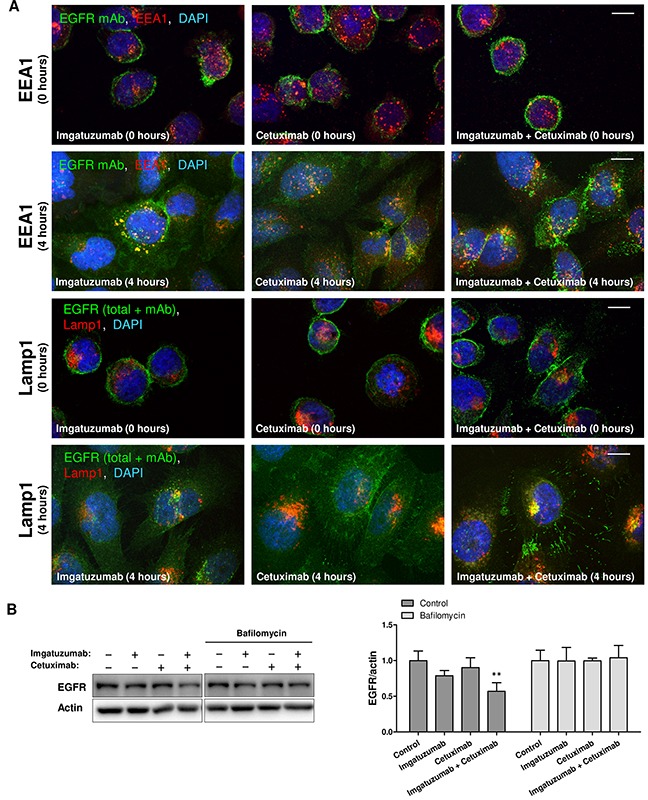
Figure 5. Cellular localization and endocytic trafficking of anti-EGFR monoclonal antibodies in SW-1573.

(A) Cells were surface labeled with the anti-EGFR monoclonal antibodies (mAbs) on ice. After staining with the primary antibody cells were washed with ice-cold FACS buffer and incubated for 4 hours at 37°C. After fixation, permeabilization, and incubation with anti-EEA1 and anti-Lamp1 antibodies, cells were incubated with fluorescent secondary antibodies (anti-human Alexa 488 against imgatuzumab and cetuximab (green color), Alexa 647-labeled antibodies for endosomal markers (red color)). For the Lamp1 staining additional anti-EGFR monoclonal antibodies were added to visualize total EGFR. Colocalization appears as yellow (merged images). Images were acquired using a confocal microscope. White scale bars represent 10 μm. (B) Western blot analysis of the effect of lysosomal inhibition on monoclonal antibody-induced EGFR degradation. SW-1573 cells were pretreated for 2 hours with the lysosomal inhibitor bafilomycin A1 (100 nM). Cells were subsequently treated with the anti-EGFR monoclonal antibodies (20 μg/mL total) for 4 hours. Data points are mean + SD. (**P < 0.01 compared to control).
