
Figure 7. In vitro ADCC analysis of imgatuzumab, cetuximab or the combination.
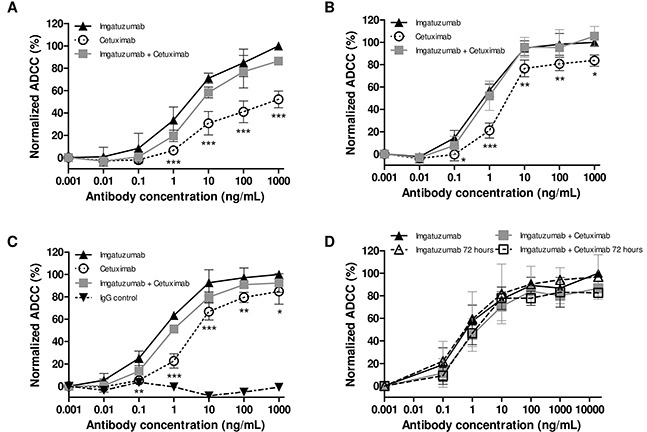
PBMCs as effector cells were added to the untreated H441 (A), H292 (B) or A549 (C) target cells at a ratio of 25:1. ADCC responses were normalized to the ADCC response of the highest imgatuzumab concentration due to variations in responses between PBMCs of different donors. Absolute ADCC responses ranged between 12 and 53%. (*P < 0.05, **P < 0.01, ***P < 0.001 cetuximab vs imgatuzumab). (D) A549 cells were pretreated with imgatuzumab alone (20 μg/mL) or combined with cetuximab (20 μg/mL total) in culture medium for 72 hours. Next, cells with (open triangle and open square) or without (solid triangle and solid square) antibody pretreatment for 72 hours were washed and the ADCC assay was performed using PBMCs as effector cells and A549 cells as target cells at a ratio of 25:1. Data points are mean ± SD (n = 3).