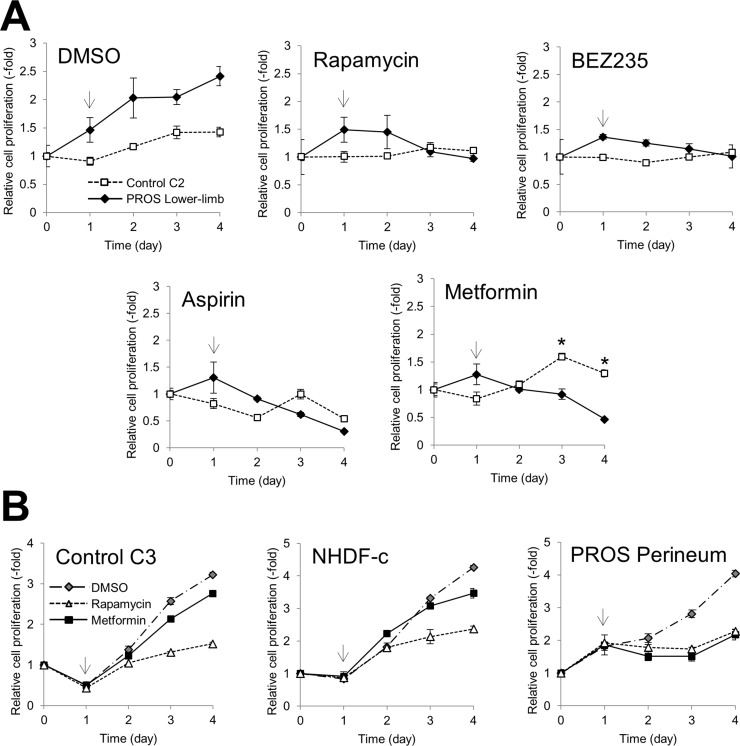
Figure 5. Effect of inhibitors of cell growth in fibroblasts.
Cell growth of PROS and control fibroblasts was assessed using the MTT assay. (A) Control fibroblasts C2 and PROS fibroblasts from the lower limb were treated with 1 nM rapamycin, 100 nM NVP-BEZ235, 5 mM aspirin, and 10 mM metformin. (B) Control fibroblast line C3, NHDF-c, and PROS fibroblasts from the perineum were treated with 1 nM rapamycin and 10 mM metformin. Arrows indicate the time point when the inhibitor was administrated. The data are normalized to Day 0. Data are expressed as mean ± S.D. (n = 3). *p < 0.05, Student's t-test.

