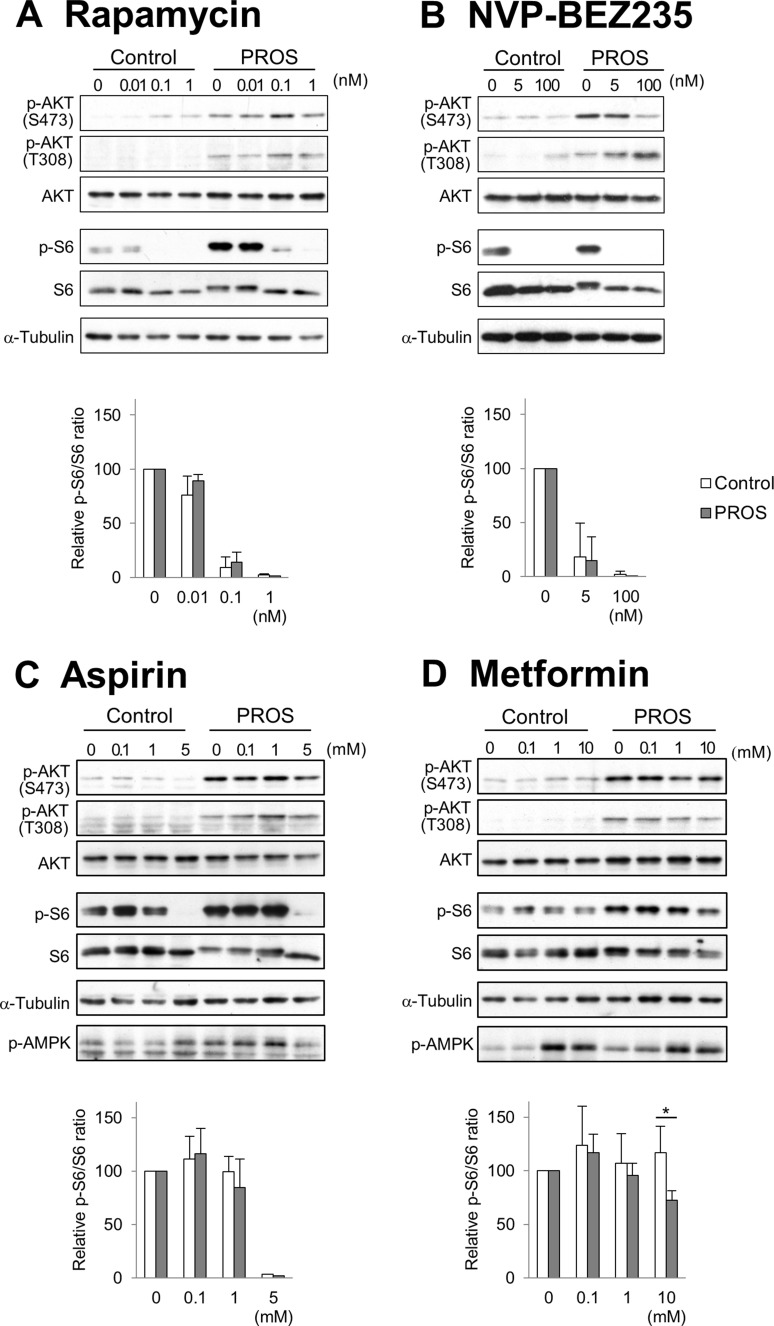
Figure 6. Dose-response study of the effects of inhibitors on PI3K/AKT/mTOR signaling.
After seeding the control fibroblasts (C2) and PROS fibroblasts from the lower limb, the cells were treated with different concentrations of rapamycin (A) NVP-BEZ235 (B) aspirin (C) and metformin (D) for 2 days. Activity of PI3K/AKT/mTOR was monitored by examining phosphorylation of AKT-S473, AKT-T308, and S6 by western blotting. AMPK activation was monitored by phosphorylation of threonine 172 with a phosphor-specific antibody. α-Tubulin served as a loading control. Representative blots from three independent experiments are shown. Quantification is presented as the relative ratio of phosphorylated S6 to total S6 in the control (white boxes) and the PROS (gray boxes) fibroblast cells. The quantification of the band intensity is normalized to the corresponding DMSO control treatment. Data are expressed as mean ± S.D. (n = 3). *p < 0.05, Student's t-tests.

