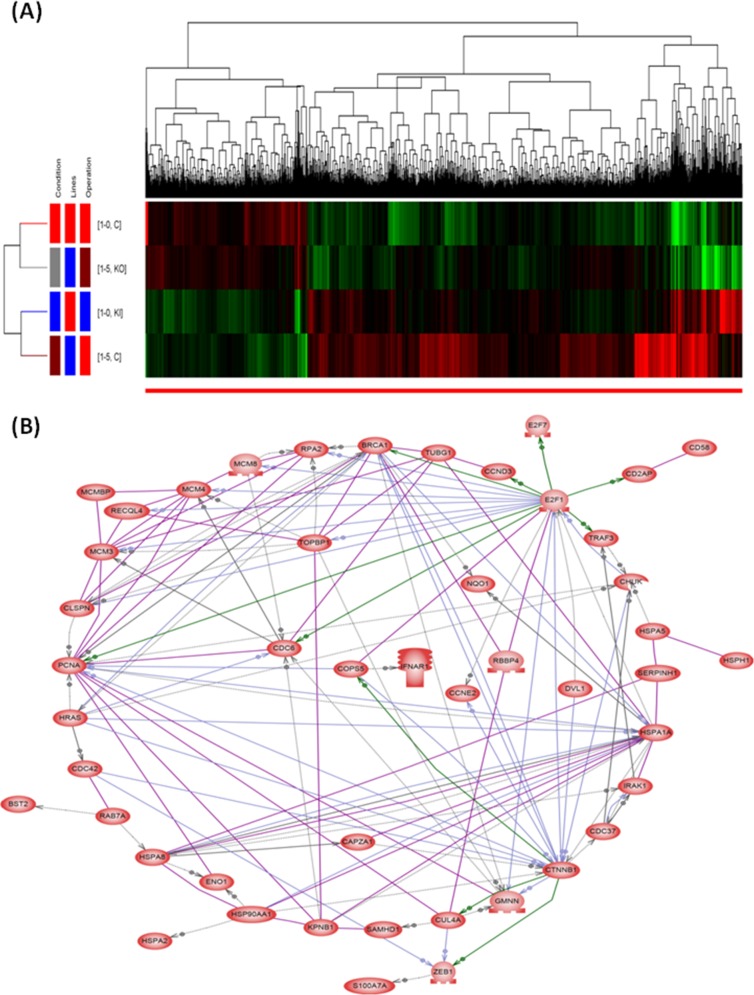
Figure 5. Hierarchical clustering dendrograms and direct interaction network of the significantly regulated genes by S100A15.
(A) The red blocks represent under-expressed genes and the green blocks represent over-expressed genes. Totally, 518 differentially expressed genes were up-regulated and 1378 down-regulated in CL1-5 and S100A15 over-expressing CL1-0 as compared with CL1-0 and S100A15 knock-down CL1-5 lung AC cell lines. (B) The seed genes enriched by the sub-network analysis among the 518 genes up-regulated by S100A15.

