


Figure 1. miR-551b is down-regulated in gastric cancer.
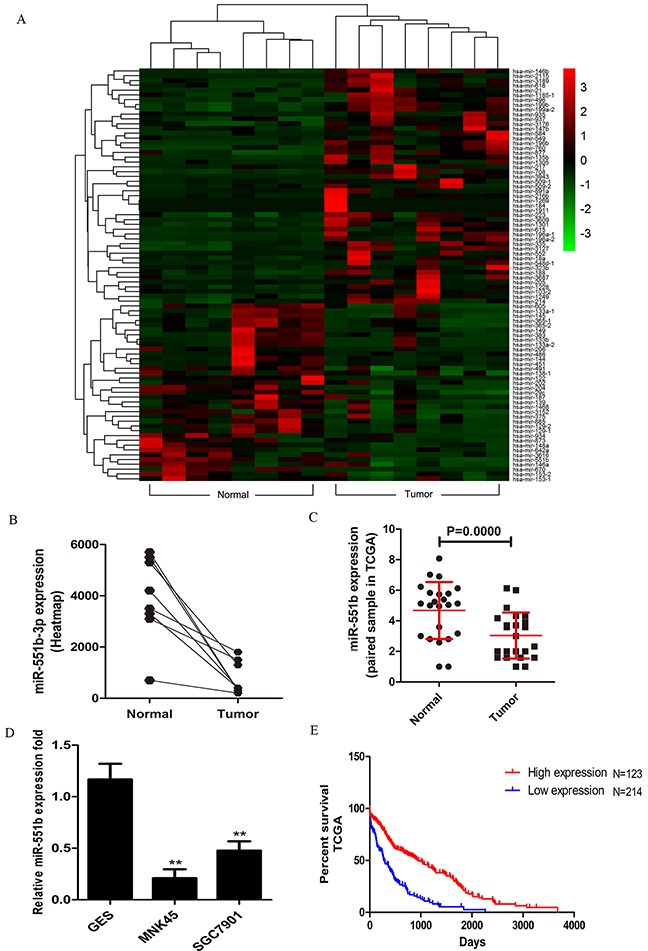
(A) Heat map analysis of the miRNA profiles for the 21 gastric cancer cases from the TCGA database using R software (Padj <0.05 and log2 fold change >3) is shown. (B) miR-551b expression between normal and tumor samples is plotted from the heat map. (C) Fold expression of miR-551b in normal and tumor tissues are shown. (D) RT-PCR analysis of miR-551b expression (fold) in GES, MNK45 and SGC7901cells is shown as mean ± SD. Note: ** is P < 0.01. (E) Plot shows the percent survival rate of GC patients with high (red) and low (blue) expression of miR-551b. High expression of miR-551b is associated with long term survival.