
Figure 3. Ioversol CEST MR images of a phantom consisting of test tubes.
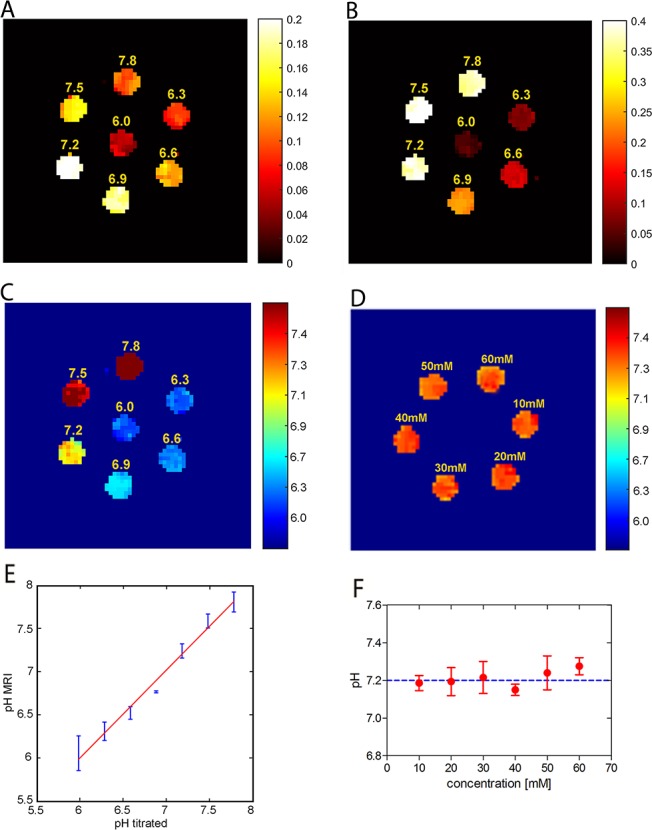
ST images of 30 mM ioversol at different pH values under RF powers of 1.5 μT (A) and 6 μT (B). (C) pH map calculated using the corresponding ST images (A and B). (D) pH mapping is independent of ioversol concentration. (E) The calculated pH values strongly correlate with the titrated pH values. (F) Mean pH values calculated for several concentrations.