
Figure 4. In vivo CEST imaging of breast cancer.
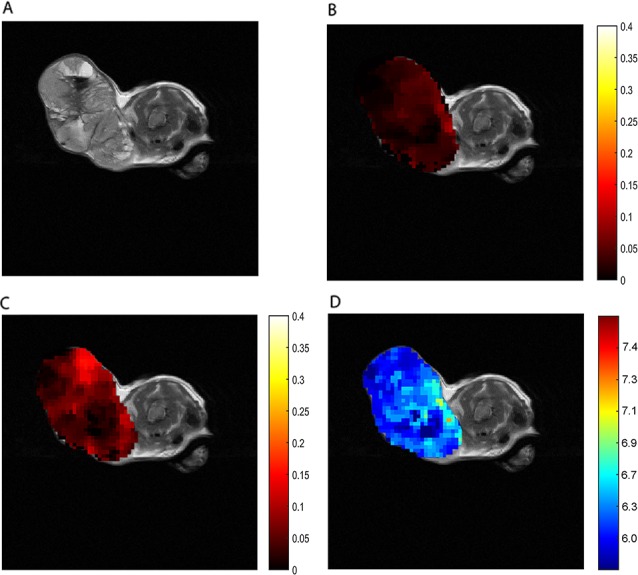
(A) T2 breast cancer image. ST map after ioversol injection at 1.5 μT (B) and 6 μT (C). (D) The pHe map calculated by using corresponding ST images (B and C).
Official websites use .gov
A
.gov website belongs to an official
government organization in the United States.
Secure .gov websites use HTTPS
A lock (
) or https:// means you've safely
connected to the .gov website. Share sensitive
information only on official, secure websites.
(A) T2 breast cancer image. ST map after ioversol injection at 1.5 μT (B) and 6 μT (C). (D) The pHe map calculated by using corresponding ST images (B and C).