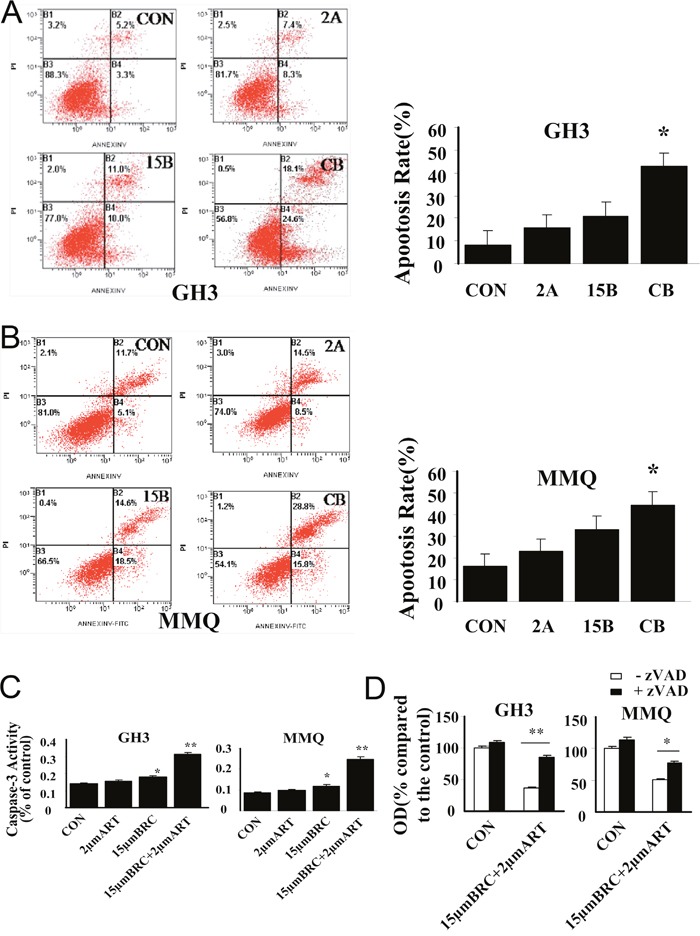
Figure 4. ART in combination with BRC activated caspase-3 and induced apoptosis.

Apoptosis in (A) GH3 and (B) MMQ cells was determined by annexin-V and PI staining and detected by flow cytometry analysis. (C) Caspase-3 activity assay detected caspase-3 activity. (D) The involvement of caspase activity in cell death induced by combination treatment with ART and BRC was analyzed by an MTT assay in the presence or absence of 10 μM caspase-3 inhibitor Z-Vad-FMK (zVAD). CON indicates negative control (untreated) cells, 2A indicates cells treated with 2 μM ART, and 15B indicates cells treated with 15 μM BRC. CB indicates combination treatment of cells with 15 μM BRC and 2 μM ART. Experiments were performed in triplicate, with one representative experiment illustrated. A single asterisk indicates p < 0.05, and paired asterisks indicate p < 0.01. Scale bar = 100 μm; -, negative; +, positive.
