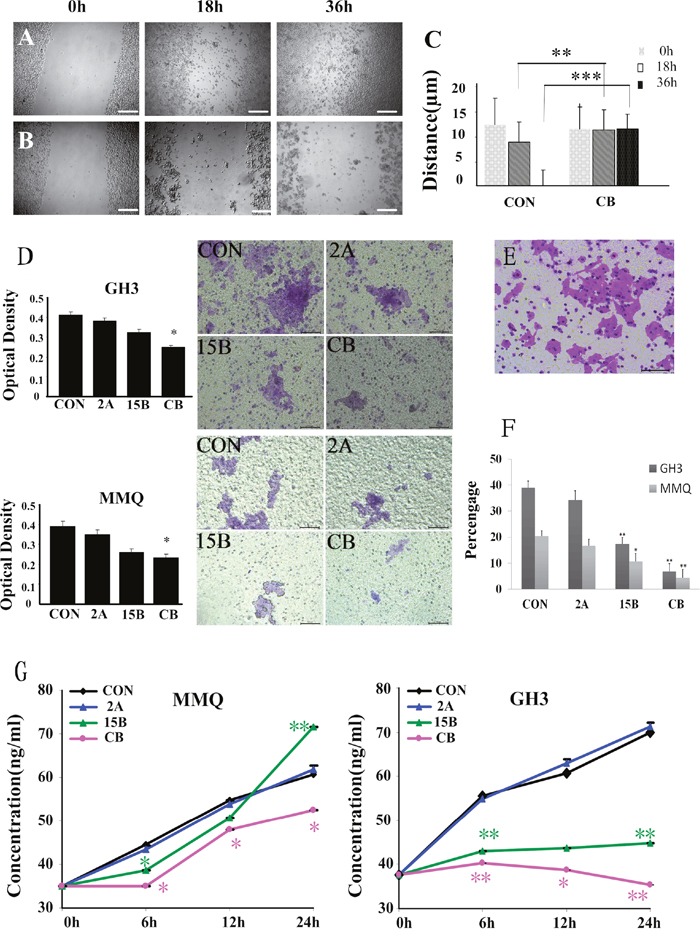
Figure 5. Wound-healing scratch assay in cells starved of serum for 24 h.

Bright field microscopy was used to determine the extent of closure under control conditions (A) compared with ART and BRC treatment (B) after 0, 18, or 36 h treatment of GH3 cells. Migration was quantified through measurement of the gap area before and after treatment (C). Cell migration was calculated with Image Pro-plus software, and is represented as the difference in the scratch area before and after treatment. A representative result is shown. Scale bar = 200 μm. (D) Invasion assay of pituitary adenoma cells. GH3 and MMQ cells that migrated through the filter to the lower chamber were evaluated by crystal violet staining and the MTT assay, respectively. (E) Invasion assay of the human hepatoma HepG2 cell line as a positive control. Scale bar = 100 μm. (F) The percentage of cells that invaded through the Matrigel and non-migrant cells on the upper side of the filter. (G) ELISA was used to estimate extracellular PRL levels secreted by GH3 and MMQ cells. The experiment was repeated at least three times. A single asterisk indicates p < 0.05, and paired asterisks indicate p < 0.01.
