
Figure 7. Pten was associated with miR-200c downregulation in combined treatment-induced apoptosis.
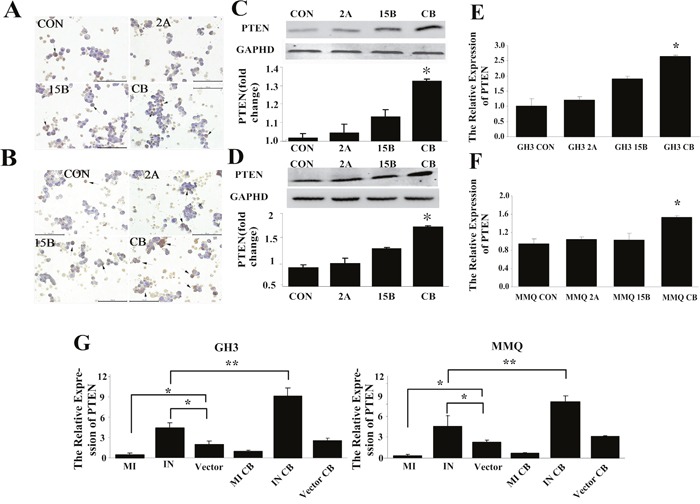
(A-F) Combination treatment with ART and BRC increased Pten expression in MMQ (A, C, E) and GH3 (B, D, F) cells. Pten mRNA and protein levels were determined by qRT-PCR (E, F), immunocytochemistry (A, B), and Western blot (C, D) analysis. Black arrows indicate positive cells; scale bar = 100 μm. (G) Expression of Pten mRNA in miR-200c-transfected cells detected by qRT-PCR. With combination treatment after miR-200c transfection, Pten mRNA decreased in analog-transfected cells and increased in inhibitor-transfected cells. All experiments were repeated three times, and representative results are shown. CON indicates control (untreated) cells. A single asterisk indicates p < 0.05 compared with untreated controls.