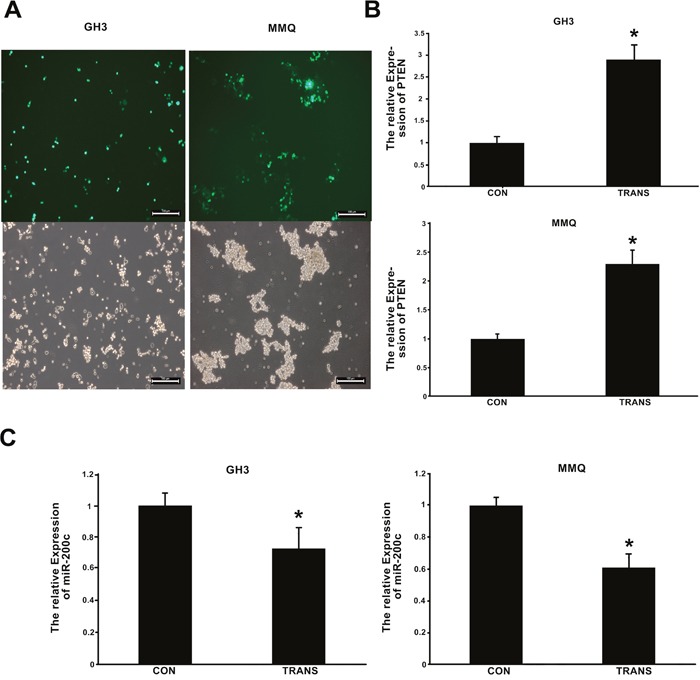
Figure 8. Expression of Pten and miR-200c 48 h after transfection of cells with pcDNA3.1/Pten and pcDNA3.1/Egfp plasmids.

(A) Green fluorescence was measured with a fluorescence microscope, and suggested that the transfection efficiency of the Pten plasmid was about 40-50%. (B, C) Pten and miR-200c expression 48 h after transfection with pcDNA3.1/Pten and pcDNA3.1/Egfp were determined by qRT-PCR. CON indicates cells transfected with pcDNA3.1/Egfp, and TRANS indicates cells transfected with pcDNA3.1/Pten. (B) Pten expression increased after transfection with pcDNA3.1/Pten. *p < 0.05. C, miR-200c expression decreased after transfection with pcDNA3.1/Pten. *p < 0.05.
