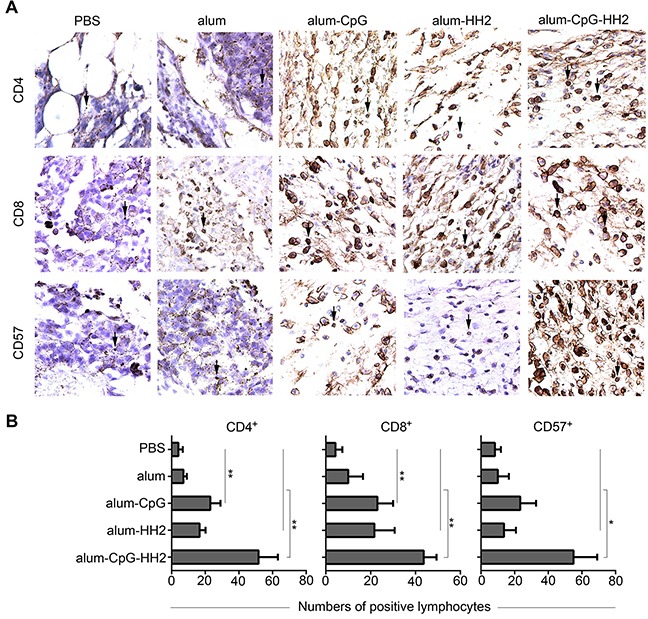
Figure 5. Lymphocyte infiltration in mice melanoma model by immunohistochemistry analyses.

(A) A part of the whole graph from IHC staining for lymphocyte infiltration in each group (box-marked graphs from Supplementary Figure 3). Serial sections of tumor tissue were stained with anti-CD4, anti-CD8 and anti-CD57 mAbs at 4°C overnight. Afterwards, sections were exposed to anti-mouse biotinylated antibody and streptavidin-biotinylated orseradish peroxidase complex. (B) The semi-quantification of CD4+, CD8+and CD57+ lymphocytes in the tumor tissues was performed. The arrows indicate the positive lymphocytes. Error bars represent mean + SEM. *p < 0.05, **p < 0.01.
