
Figure 2. The induction of autophagy by DHA in Cal-27 cells.
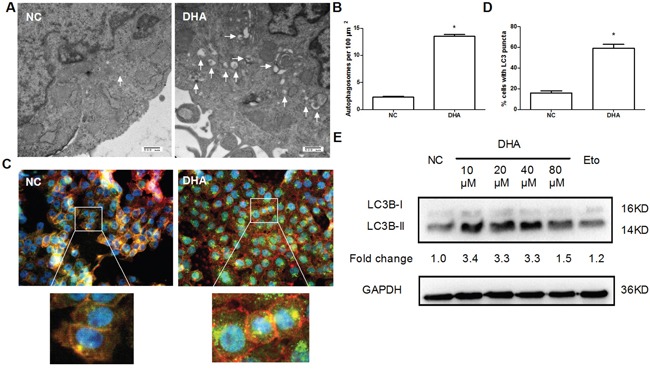
(A) Autophagosomes were checked by transmission electron microscopy. Cal-27 cells were treated with or without 24.5μM DHA for 24h, then fixed, embedded, sectioned, mounted, and stained as described in Materials and Methods. The autophagosome was indicated by white arrow. Scale bar 500 μm. (B) The quantitative data for autophagosomes were obtained from 3 sets of experiments. A total of 20 cells were counted for each variable. * P<0.05 vs. NC group. (C) DHA-induced autophagosomes were detected in Cal-27 cells by immunofluorencent staining of LC3B (green) (1000×). Cells were treated as described above. F-actin (red) was stained with Phalloidine. Nuclei (blue) were counter-stained with DAPI. (D) Quantitative analysis of autophagosomes with green-fluorescent puncta. Fifty cells were counted for each variable. * P<0.05 vs. NC group. (E) The autophagy-associated proteins LC3B-I/II were detected by Western blotting. Cal-27 cells were treated with indicated concentrations of DHA for 24 h, and then harvested for examining the expression levels. 40μM Etopside was used as DNA double-strand break positive control. GAPDH was used as a loading control. All experiments were performed in triplicates.