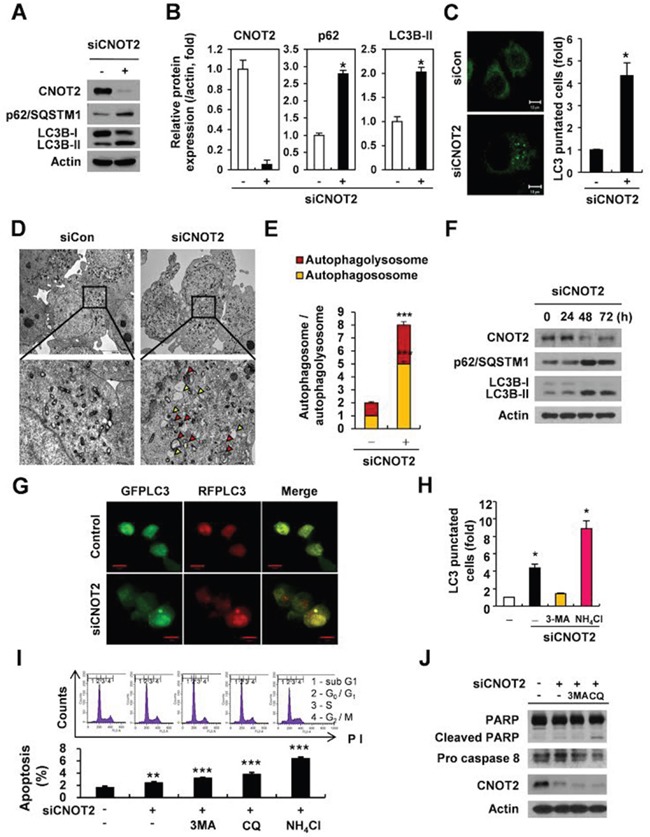
Figure 1. Depletion of CNOT2 induces autophagy via accumulation of p62/SQSTM1 and LC3B-II conversion, LC3 fluorescent puncta and autophagosomes, but impairs autophagic flux in H1299 cells.

(A) Western blotting was conducted for p62/SQSTM1 and LC3B-II in H1299 cells transfected with CNOT2 siRNA. (B) ImageJ densitometric analysis of the relative CNOT2, p62/SQSTM1 and LC3B-II protein expression levels (means ± SD of 3 independent experiments, *p < 0.05 vs untreated control by Student t test). (C) Accumulation of LC3 fluorescent puncta in H1299 cells transfected with CNOT2 siRNA compared to untreated control in H1299 cells (means ± SD of 3 independent experiments, * p < 0.05 vs untreated control by Student t test). (D) A number of autophagosomes and autophagolysosomes were observed in H1299 cells transfected with CNOT2 siRNA by TEM. The below panel is the enlarged image for the black frame. Autophagosomes and autophagolysosomes were represented by white and black arrowheads, respectively. Scale bar regular image: 10 μm, enlarge image: 2 μm. (E) Quantitative analysis of autohagosome and autophagolysosome in H1299 cells transfected with CNOT2 siRNA (means ± SD of 3 independent experiments, *** p < 0.001 vs untreated control by Student t test). (F) Effect of CNOT2 depletion on the expression of p62 and LC3B-II in CNOT2 depleted H1299 cells in a time course. (G) Depletion of CNOT2 inhibited autophagic flux in H1299 cells. Representative confocal images were exhibited in H1299 cells co-transfected with siCNOT2 and RFP-LC3 and GFP-LC3 constructs. Autophagosome was visualized as yellow or orange puncta (RFP-GFP-LC3B) in merged images, whereas red puncta (RFP-LC3B) represents autophagolysosome, since acidification reduces green fluorescence. Scale bar: 10 μm. (H) Quantitative analysis of LC3-puncta in H1299 cells transfected with CNOT2 siRNA in the present or absence of autophagy inhibitor 3-MA or NH4Cl (means ± SD of 3 independent experiments, * p < 0.05 vs untreated control by Student t test). (I) Effect of autophagy inhibitors on sub G1 population in CNOT2-depleted H1299 cells. Cells were transfected with CNOT2 siRNA for 24 h and treated with 3-MA, CQ and NH4Cl for another 24 h. Then the cells were fixed with 75 % ethanol and stained with 50 mg/ml of PI. The cell cycle analysis was performed using FACs Calibur, and the data were analyzed using CellQuest Software (means ± SD of 3 independent experiments, ** p < 0.01, *** p < 0.001 vs untreated control by Student t test). (J) Effect of autophagy inhibitors on PAPR cleavage and procaspase 8 in H1299 cells transfected with CNOT2 siRNA. Cells were transfected with CNOT2 siRNA for 48 h, exposed to 3MA or CQ for 24 h and Western blotting was conducted with antibodies of PAPR cleavage, procaspase 8, CNOT2 and actin.
