
Figure 1. The anticancer effect of IFNγ on cervical cancer.
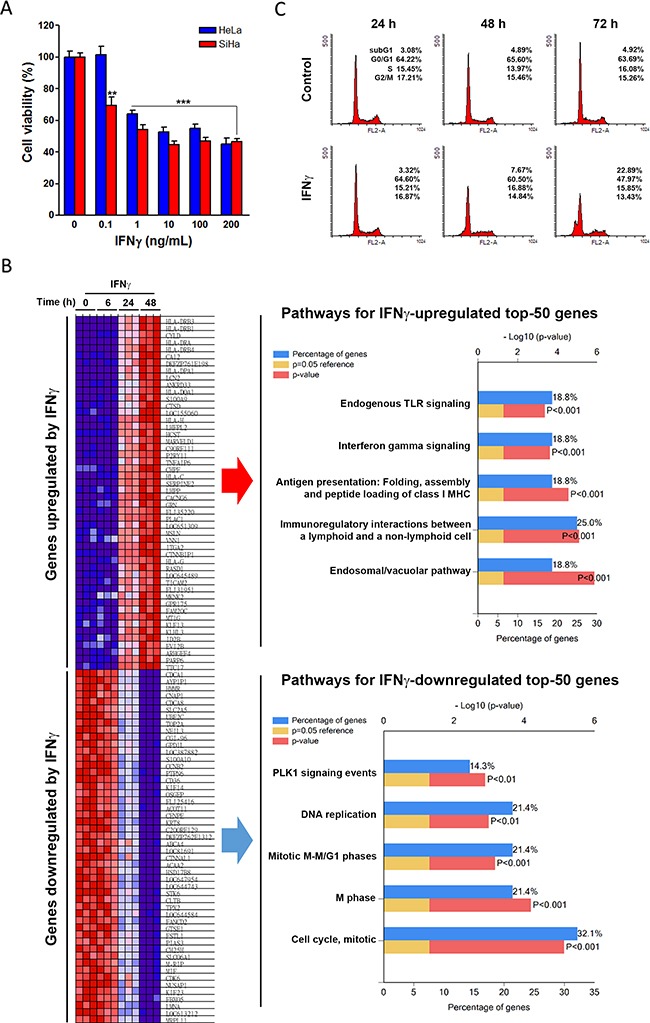
(A) HeLa and SiHa cells were treated with the indicated doses of IFNγ for 72 h, and then cell viability was examined by MTT assay. A p value of < 0.01 (**) or < 0.001(***) indicates significant differences between IFNγ-treated and control cells. (B) The microarray data of IFNγ-treated HeLa cells were analyzed by GSEA. The most upregulated and downregulated genes were illustrated on a heat map. Top-50 genes upregulated and downregulated by IFNγ were further analyzed by the FunRich software for pathway enrichment. Pathways were ranked according to the p value (red bar). A p value lower than 0.05 (yellow bar) was considered significant. The blue bar indicated the percentage of altered genes in a whole pathway. (C) HeLa cells were treated with 100 ng/mL IFNγ for 24, 48, and 72 h, and then cell cycle distribution was examined by flow cytometry.