
Figure 2. Analysis for the hallmark of cervical cancer.
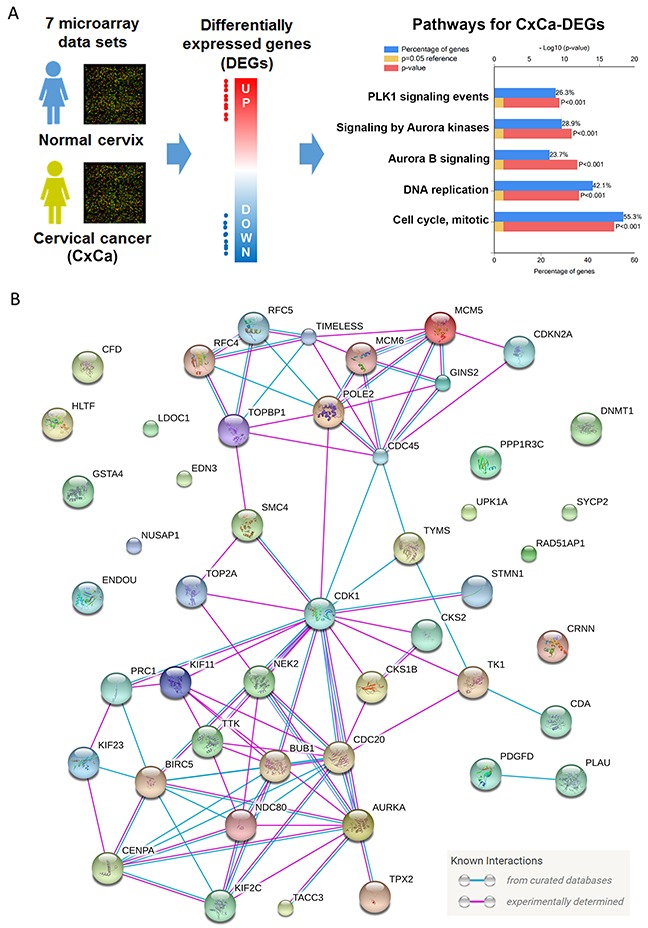
(A) DEGs obtained from cervical cancerous v.s. normal tissues were analyzed by the FunRich software for pathway enrichment. Pathways were ranked according to the p value (red bar). A p value less than 0.05 (yellow bar) was considered significant. The blue bar indicated the percentage of altered genes in a whole pathway. (B) The network of CxCa-DEGs was reconstituted by the STRING database.