
Figure 8. The combinational anticancer activity of apigenin and IFNγ.
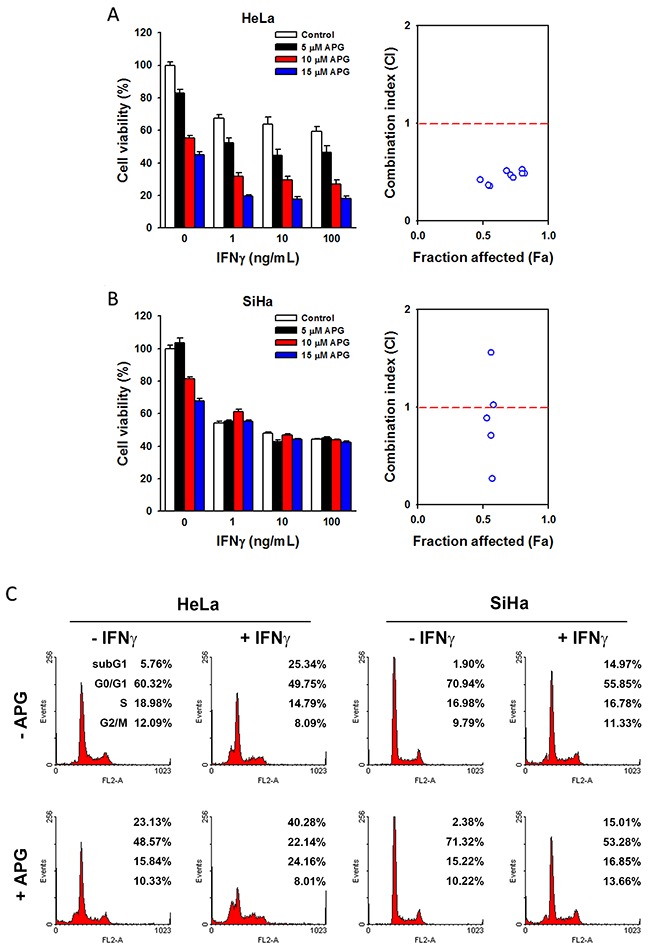
(A, B) HeLa and SiHa cells were treated with different doses of apigenin and IFNγ (alone or in combinations) for 72 h. In left parts, the cell viability was analyzed by an MTT assay. In right parts, the combination index (CI) was calculated as described in the Materials and Methods, and then plotted against the values of fraction affected (Fa). The CI values higher than 2 were not shown in Fa-CI plot. (C) HeLa and SiHa cells were treated with 100 ng/mL IFNγ for 72 h with or without 10 μM apigenin, and then cell cycle distribution was examined by flow cytometry.