
Figure 2. Effect of 5azadC treatment on cellular transcription factor expression.
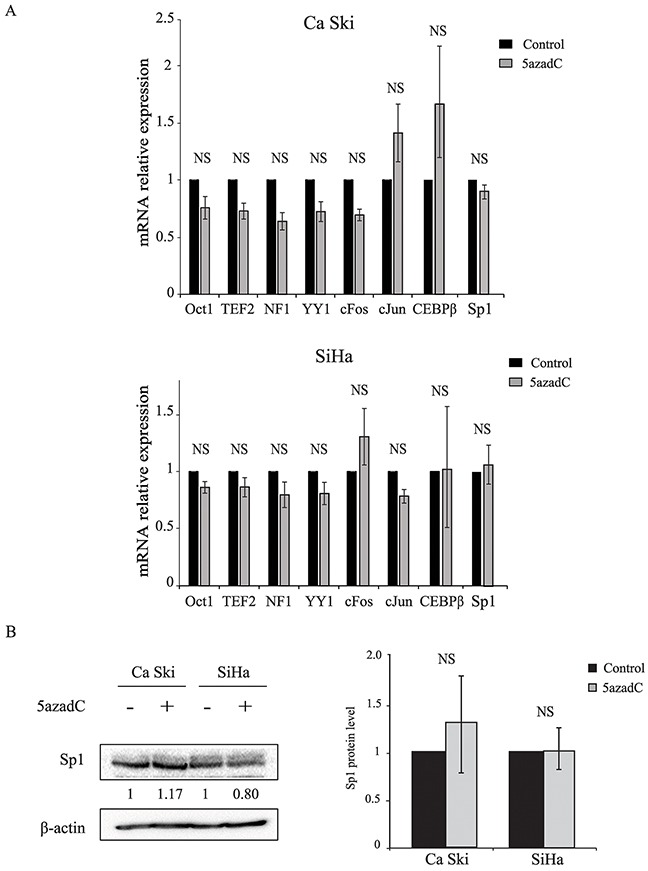
(A) Total RNAs were extracted from Ca Ski and SiHa cells treated or not with 5azadC for 96h and the relative expression of Oct1, TEF-2, NF1, YY1, cFos, cJun, CEBPβ and Sp1 mRNA was measured by RT-qPCR and normalized to β2M mRNA level. The data are presented as mean values from at least three independent experiments. Error bars represent the standard deviation and p values were calculated by performing Mann-Whitney test: NS: no significant. (B) Mock treated and 5azadC-treated (0.25 μM for 96h) Ca Ski and SiHa cells were lysed and the protein fraction was assayed for the presence of Sp1 by Western blotting. β-actin served as a loading control. A representative blot is shown; the values of the densitometric analysis were normalized with β-actin (left). The data are presented as mean values from at least three independent experiments. Error bars represent the standard deviation and p values were calculated by performing Mann-Whitney test: NS: no significant (right).