
Figure 3. E6 RNA splicing pattern is not modified by 5azadC treatment.
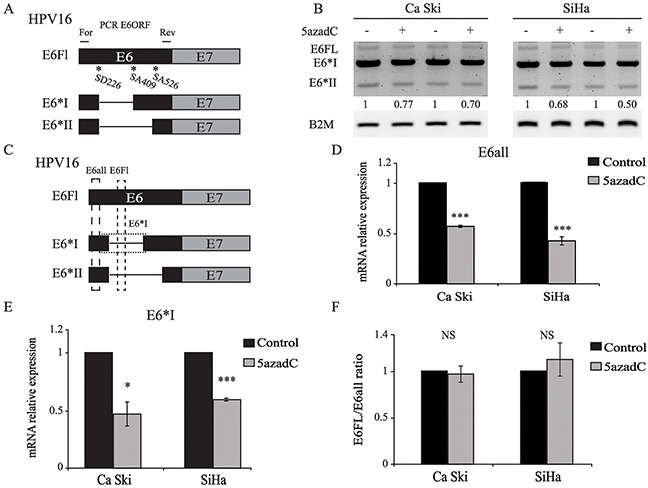
(A) Splicing pattern of E6 RNAs. The position of forward (For) and reverse (Rev) primers is shown. (B) Total RNAs were extracted from mock treated and 5azadC-treated (0.25 μM for 96h) Ca Ski and SiHa cells. Two representative and independent RT-PCR analysis of the E6ORF show E6Fl, E6*I and E6*II mRNA after gel electrophoresis. Semi-quantitation of all E6 transcripts was carried out by densitometry analysis normalized to β2M mRNA level. (C) Schematic view of E6all, E6Fl and E6*I RT-qPCR products. (D, E) E6all (D) and E6*I (E) mRNA were quantified by RT-qPCR and normalized to β2M mRNA level in three independent experiments. (F) E6Fl/E6all mRNA ratios were calculated to reveal changes in the splicing pattern of E6 transcripts. The data are presented as mean values from at least three independent experiments. Error bars represent the standard deviation and p values were calculated by performing Mann-Whitney test: * p < 0.05; *** p < 0.001; NS: not significant.