
Figure 4. Destabilization of E6 transcripts after 5azadC treatment.
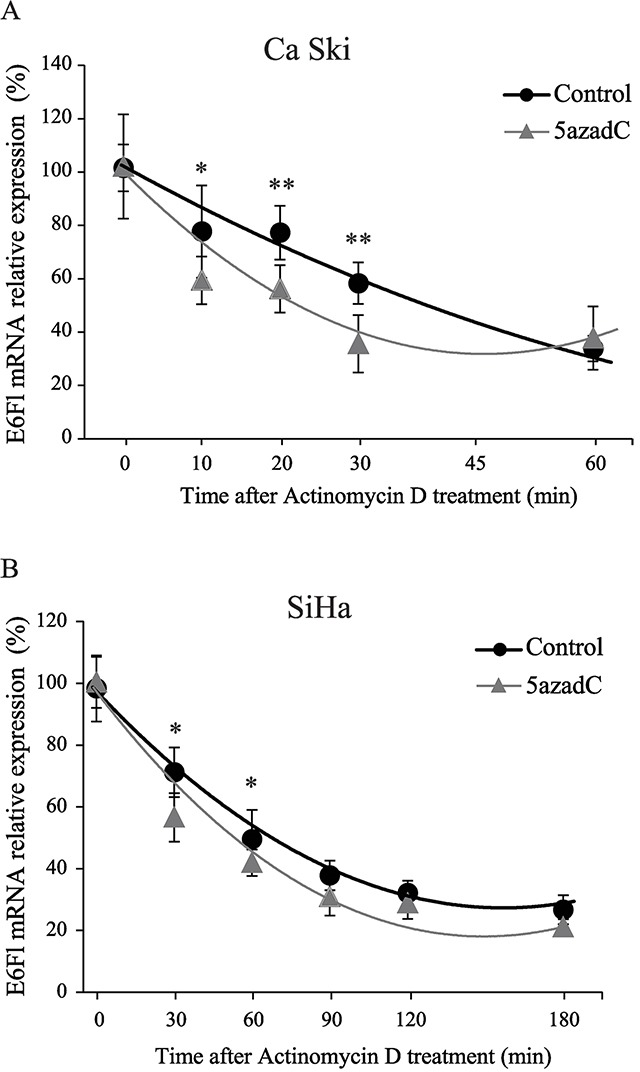
(A, B) RNAs were extracted from Ca Ski (A) and SiHa (B) cells treated or not with 5azadC at 0.25 μM during 96h and treated with 4 μg/mL actinomycin D. Relative expression of E6Fl mRNA was determined by RT-qPCR and normalized to β2M mRNA level. The diagram shows the mean values for at least three independent experiments and the standard deviation. Mann-Whitney`s test was performed to calculate p values using DMSO treated cells as a reference control. *p < 0.05, **p < 0.01.