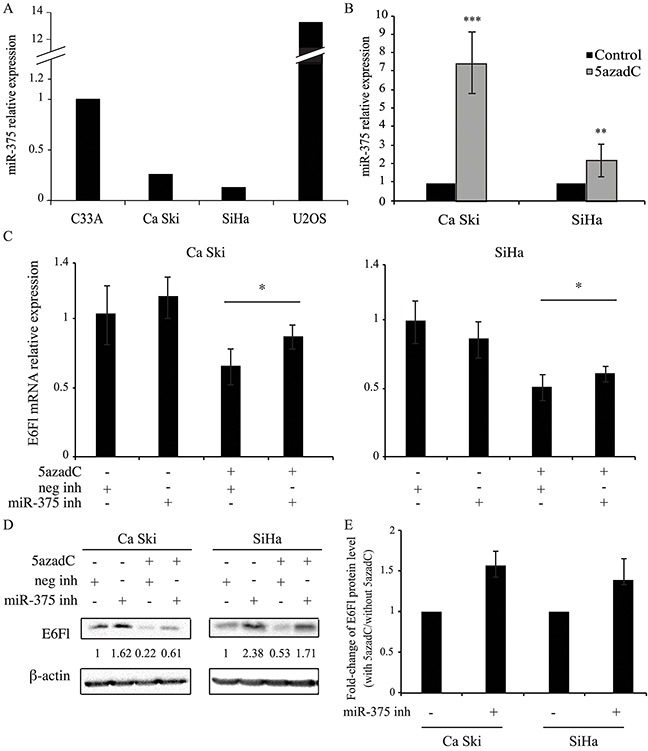
Figure 5. miR-375 is involved in the decrease of E6 expression.

(A, B) miR-375 relative expression was quantified by RT-qPCR and normalized to U6 snRNA level in C33A, Ca Ski, SiHa and U2OS cells (A) and in Ca Ski and SiHa cells (B) treated or not with 0.25 μM of 5azadC for 96h. The data are presented as mean values from at least three independent experiments. Error bars represent the standard deviation and p values were calculated by performing Mann-Whitney test: ** p < 0.01; *** p < 0.001 (B) (C, D) Ca Ski and SiHa cells were treated with 5azadC at 0.25 μM during 96h. Cells were transfected with miRIDIAN microRNA negative control or miR-375 inhibitors at 200 nM during the last 24h. E6Fl mRNAs were analyzed by RT-qPCR and normalized to β2M mRNA level (C) and E6 proteins were analyzed by Western blotting and normalized to β-actin protein level (D). The data are presented as mean values from at least three independent experiments. Error bars represent the standard deviation and p values were calculated by performing Mann-Whitney test between 5azadC-treated cells +/− miR-375 inhibitor: * p < 0.05 (E) Fold-change in E6Fl protein levels induced by miR-375 inhibitor was calculated in 5azadC-treated cells compared to control cells. The data are presented as mean values from at least three independent experiments. Error bars represent the standard deviation and p values were calculated by performing Mann-Whitney test: p=0.06 for both cells.
