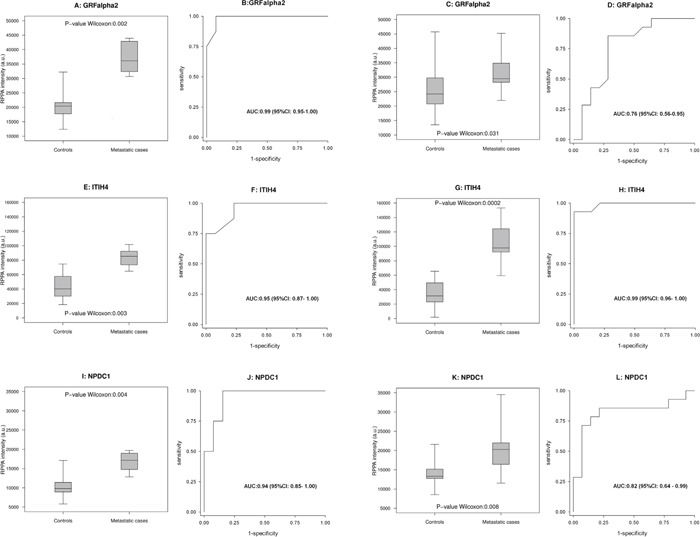
Figure 4. Proteins validated with RPPA analysis.

Box-plot (A, E, I) and ROC curve (B, F, J) for GFRalpha2, ITIH4 and NPDC1, respectively, in 8 metastatic cases and 13 controls in cohort 1. (C, G, K, D, H and L) likewise show the results for the same proteins in the 14 metastatic cases and 14 controls in cohort 2.
