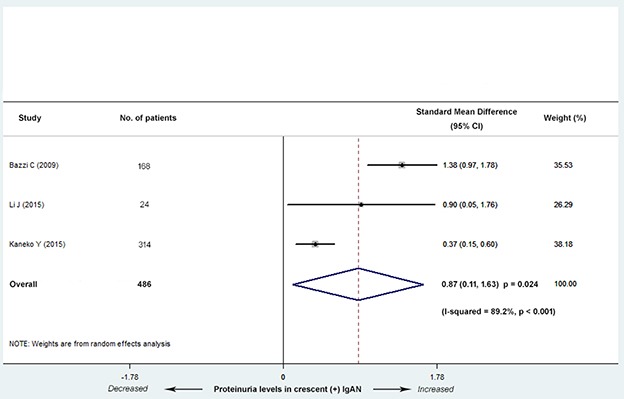
Figure 4. Standard mean differences (SMD) for the level of proteinuria for patients with versus without cellular/fibrocellular crescents.

The IgAN patients with crescents had increased proteinuria levels (SMD, 0.87; 95% CI, 0.11-1.63; P = 0.024), with high heterogeneity (I2 = 89.2%; P < 0.001).
