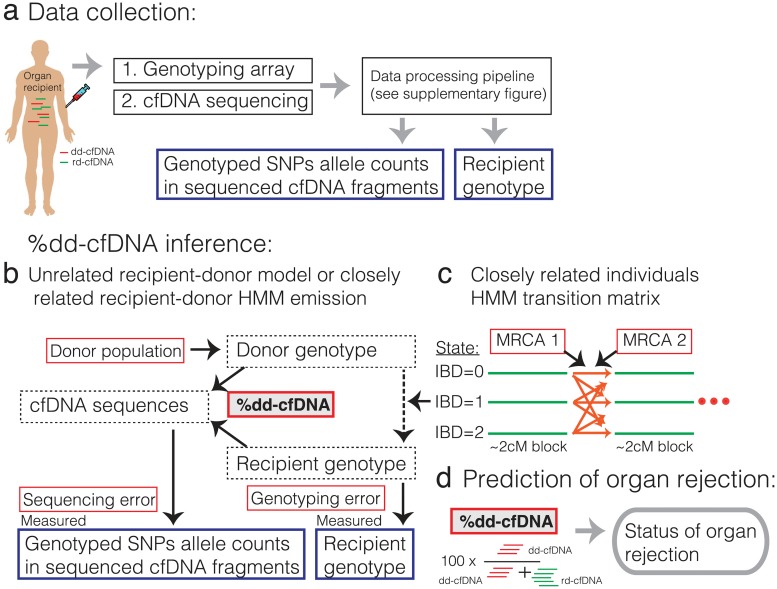
Fig 1. Illustration of our approach.
(a) A blood sample is used to genotype the recipient (cellular fraction, done once) and to sequence the cfDNA (see S1 Fig for details). (b-c) Illustration of the “one-genome” statistical model for inferring the percent of dd-cfDNA (red box with gray background). Black arrows show statistical dependency and text boxes show nuisance parameters (red box with white background), hidden variables (dotted line box) and measured data (blue box). (b) Shows the model which assumes that the donor and the recipient are unrelated. (c) When donor and recipient may be closely related (in this work, in case of a bone marrow transplant) the donor genotype depends on the recipient genotype and the local identity by descent (IBD) state between the recipient and donor genotypes. IBD states are modeled for each block of ~2cM along the genome. Transitions between IBD states depend on the number of meioses that separate each pair of recipient-donor chromosomes given their most recent diploid common ancestor (MRCA 1 and MRCA 2). (d) the inferred percent of dd-cfDNA is used to predict organ rejection.

