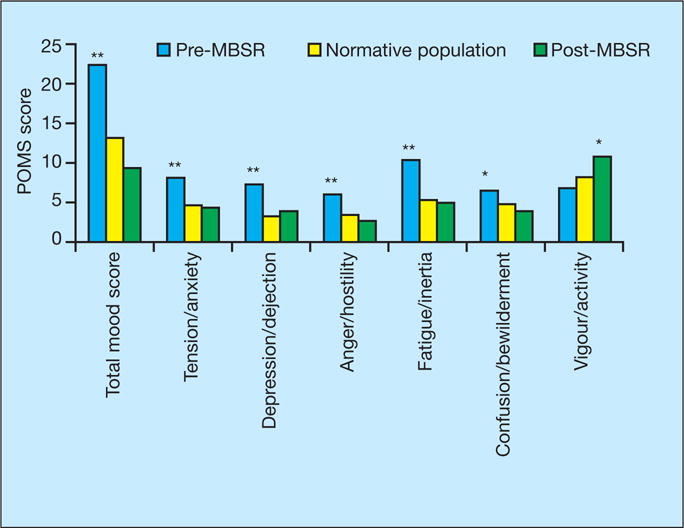
Figure 1. Pre- and post-POMS (Profile of Mood States) scores compared to population normative values.

Comparisons are of mood scores (1) pre-MBSR vs normative population, and (2) post-MBSR vs normative population; *p<0.05; **p<0.001.

Comparisons are of mood scores (1) pre-MBSR vs normative population, and (2) post-MBSR vs normative population; *p<0.05; **p<0.001.