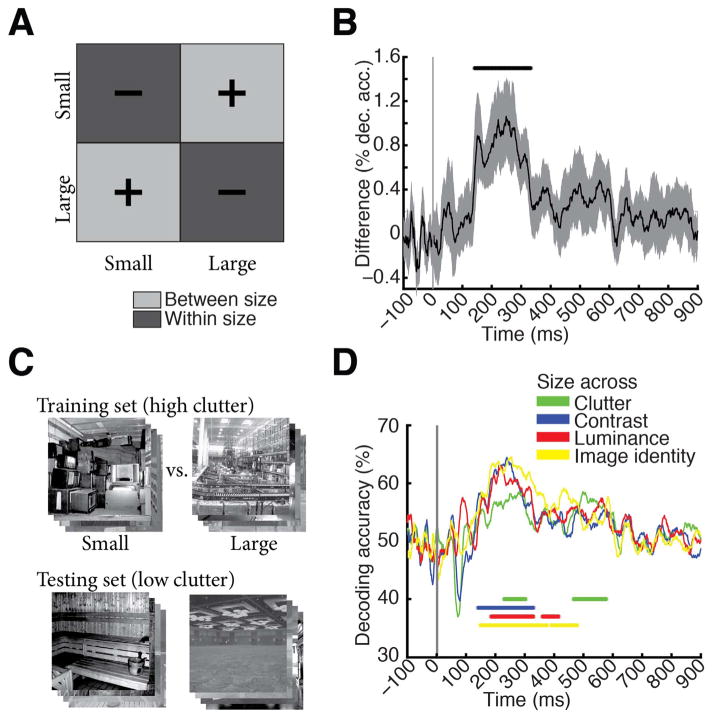
Fig. 2. Scene size is discriminated by visual representations.
A) To determine the time course of scene size processing we determined when visual representations clustered by scene size. For this we subtracted mean within-size decoding accuracies (dark gray, −) from between-size decoding accuracies (light gray, +). B) Scene size was discriminated by visual representations late in time (onset of significance at 141ms (118–156 ms), peak at 249 ms (150–274 ms). Gray shaded area indicates 95% confidence intervals determined by bootstrapping participants. C) Cross-classification analysis, exemplified for cross-classification of scene size across clutter level. A classifier was trained to discriminate scene size on high clutter images, and tested on low clutter images. Results were averaged following an opposite assignment of clutter images to training and testing sets. Before entering cross-classification analysis, MEG trials were grouped by clutter and size level respectively independent of image identity. A similar cross-classification analysis was applied for other image and scene properties. D) Results of cross-classification analysis indicated robustness of scene size visual representations to changes in other scene and image properties (scene clutter, luminance, contrast and image identity). Horizontal lines indicate significant time points (n=15, cluster-definition threshold P < 0.05, corrected significance level P < 0.05); gray vertical line indicates image onset. For result curves with 95% confidence intervals see Supplementary Fig. 2.

