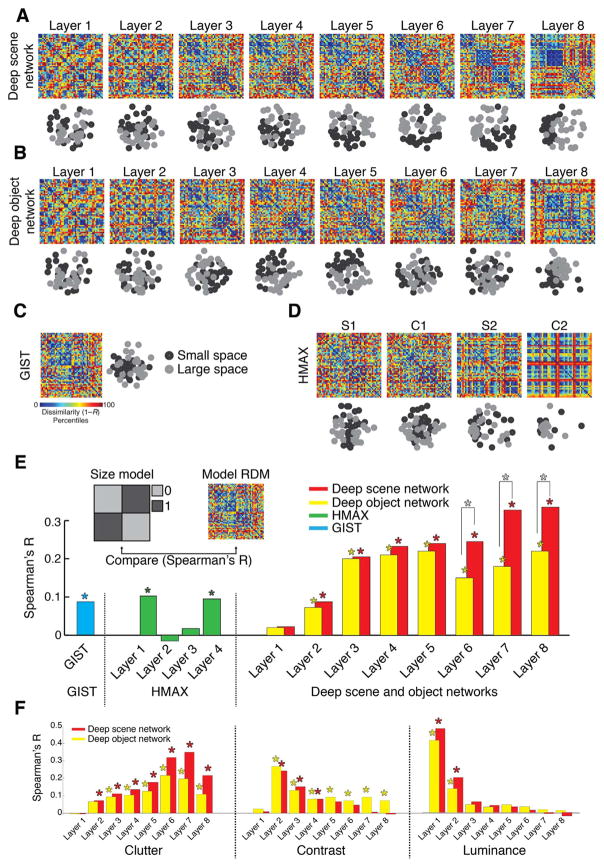
Fig. 4. Representation of scene size in computational models of object and scene categorization.
A–D) Layer-specific RDMs and corresponding 2D multidimensional scaling (MDS) plots for a deep scene network, deep object network, GIST, and HMAX. MDS plots are color-coded by scene size (small = black; large = gray). E) Quantifying the representation of scene size in computational models. We compared (Spearman’s R) each model’s RDMs with an explicit size model (RDM with entries 0 for images of similar size, 1 for images of dissimilar size). Results are color-coded for each model. F) Similar to (E) for clutter, contrast and luminance (results shown only for deep scene and object networks). While representations of the abstract scene properties size and clutter emerged with increasing layer number, the low-level image properties contrast and luminance successively abstracted away. Stars above bars indicate statistical significance. Stars between bars indicate significant differences between the corresponding layers of the deep scene vs. object network. Complete layer-wise comparisons available in Supplementary Fig. 7 (n=48; label permutation tests for statistical inference, P < 0.05, FDR-corrected for multiple comparisons).

