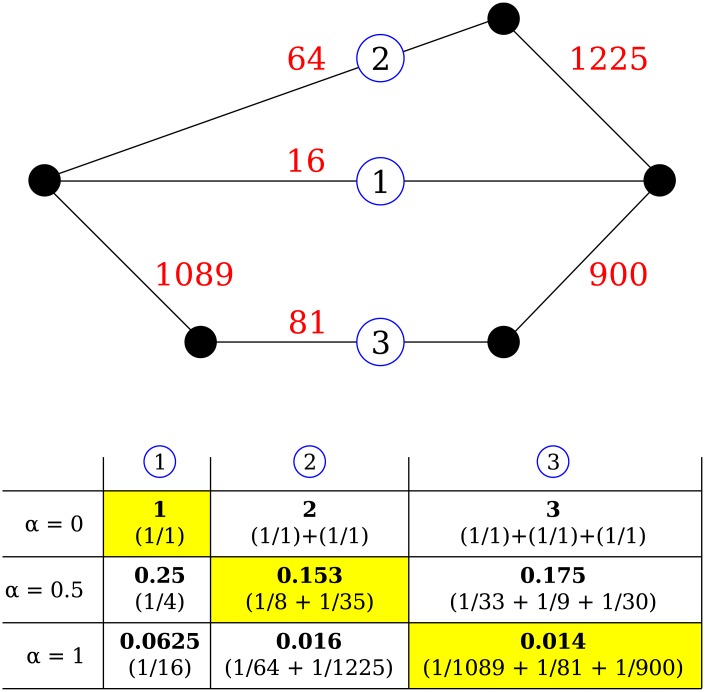
Fig 1. Schematic representation of measuring the network distance depending on the scaling parameter α.
Dots represent hospitals, red numbers show the number of patients shared between them. Route 1 is a direct route between the left and right hospital through a weak connection, while the other routes are indirect, through a mixture of strong and weak connections. The table shows the calculated distances for each route for three values of a (0.0, 0.5, and 1.0); Each route in this example can be the shortest (in yellow) depending on the exact value of α.

