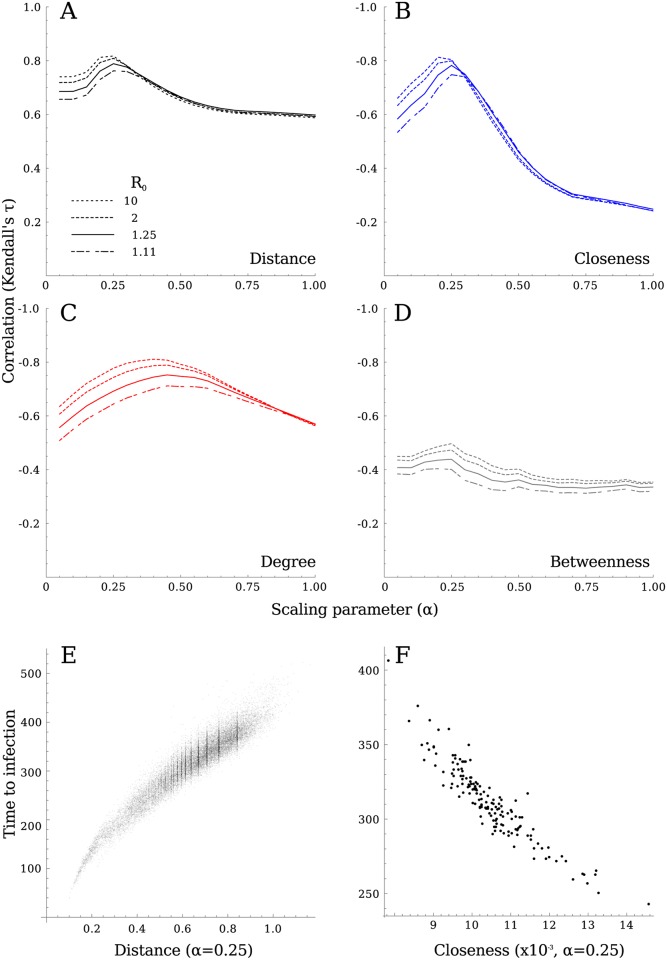
Fig 4. Determining the appropriate weighting between number of steps (α = 0) and the edge weight (α = 1) to measure the distance through the hospital network.
A) The correlation between network distance and time to infection in the stochastic simulations shows a peak around α = 0.25. The exact value does not strongly depend on the modelled R0, or other model parameters (see S2–S4 Figs for further sensitivity analyses), with longer delays and higher introduction probabilities only slightly shifting the optimum to lower α. The mean time to infection, reflecting the risk of a hospital getting infected, relates to the hospital’s centrality. B) Although closeness showed the best correlation (at α = 0.30), C) degree centrality performs only marginally less well (at α = 0.50 − 0.60), while D) betweenness showed a poor correlation, with no clear optimal value for α. E) The time to infection as a function of shortest path length between all hospitals using α = 0.25, is strongly correlated with network distance. F) The correlation between the mean time to infection and closeness for each hospital.

