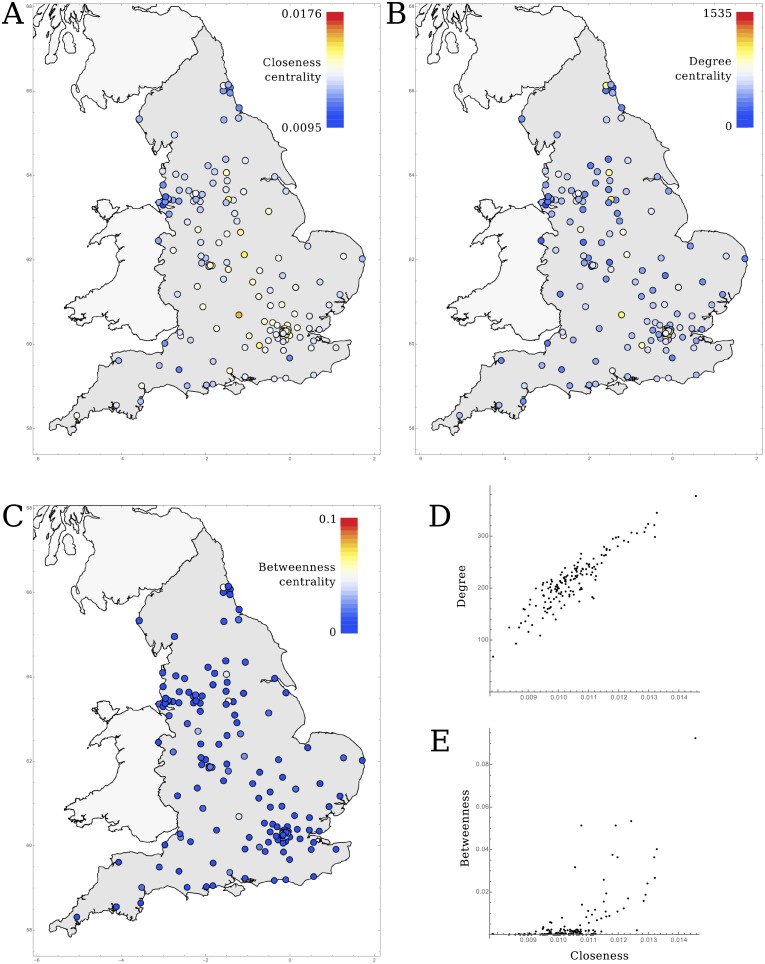
Fig 5.
The distribution of centrality of hospitals in England, showing A) closeness centrality (at α = 0.25), B) degree centrality (at α = 0.55), and C) betweenness centrality (at α = 0.25). D&E) show the correlation between closeness and degree or betweenness, respectively. Closeness and degree centrality are strongly correlated, while only few hospitals with high closeness showed high betweenness.

