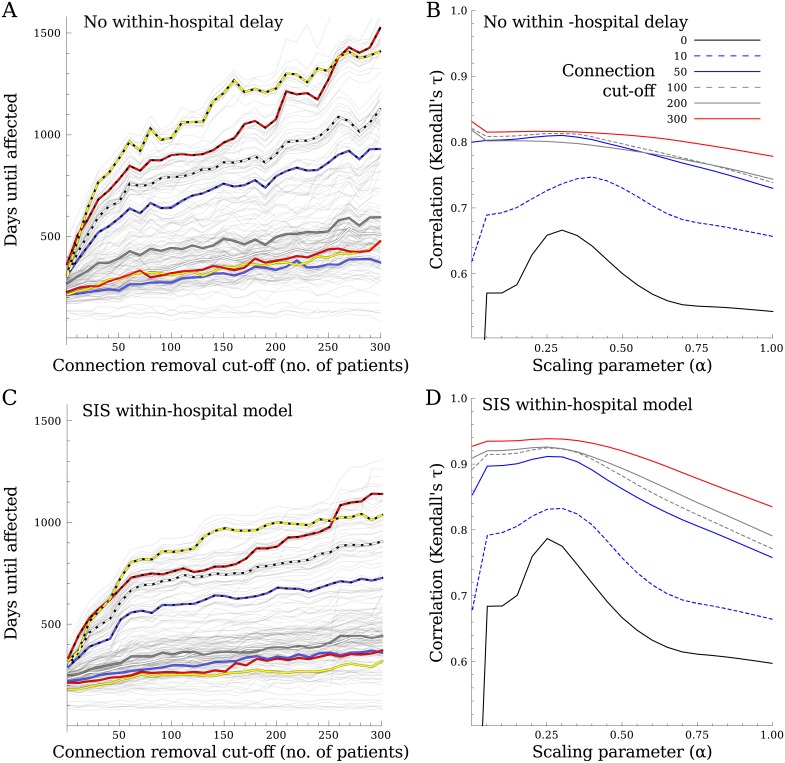
Fig 7. To test the effect of weak links, any connection with fewer patients than varying thresholds were removed.
Thresholds with incremental steps of 10 patients were used, until the first hospital became disconnected from the rest of the network at 308 patients. A&C) The time until hospitals (thin grey lines) and referral regions (thick coloured lines) are affected as a function of the strength of the weak links being removed. B&D) The correlation between the simulated spread and the measured distance, when using networks with the weakest links removed for a number of thresholds. A&B) show the results for simulations without the within-hospital delay, C&D) show the results using the SIS within-hospital model, with a different parameter set to result in similar time to infection using all connections. Both the time to infection and the correlations increase when removing the weak links. If more of the weak links are removed, the exact value α starts to matter less for the correlation between time to infection and network distance.

