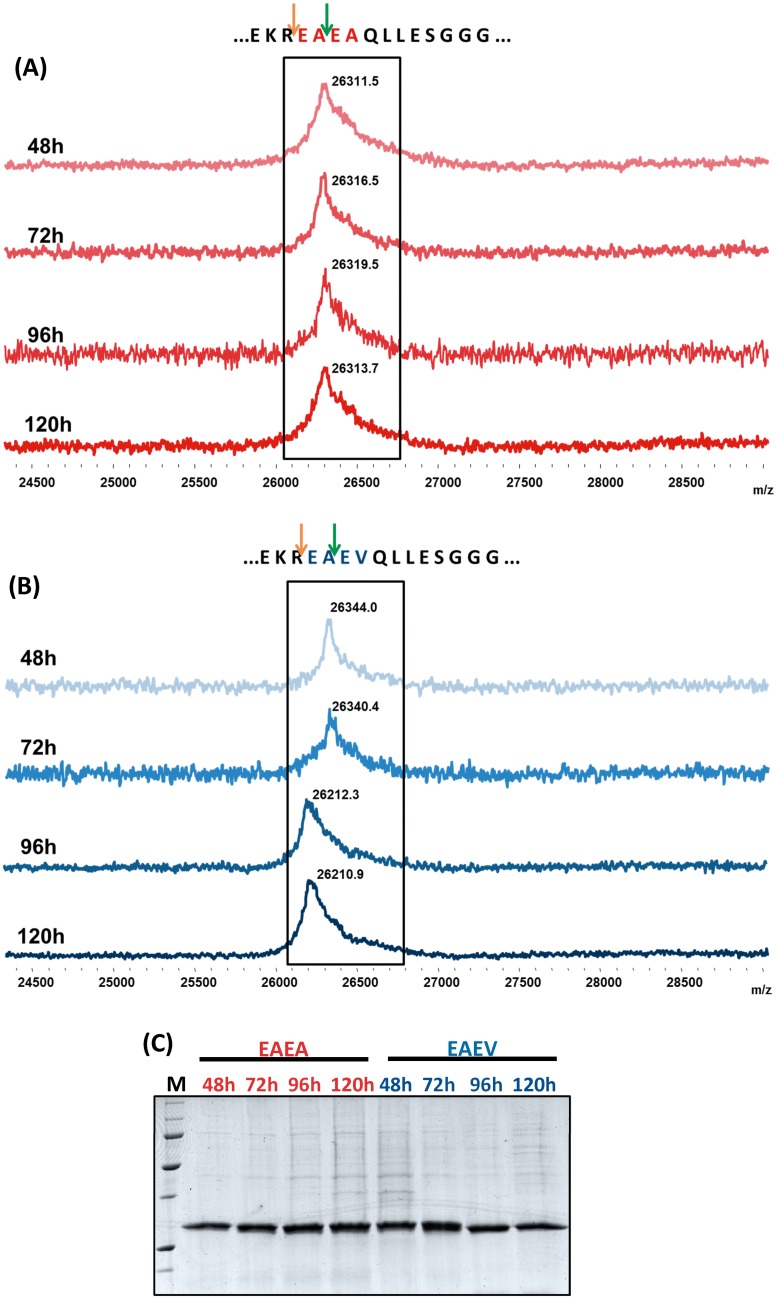
Fig 1.
Mass spectrometry MALDI-TOF analysis of protein expression at 48h, 72h, 96h and 120h after induction of EAEA (A) and EAEV (B) variants. Orange arrows indicate the Kex2 cleavage site and green arrows indicate the STE13 one. While the molecular weight of the EAEV variant (26142.0 or 26342.2 Da depending on the protease cleavage site) changed during the induction period, the EAEA variant (26114.0 or 26314.2 Da) maintained a homogenous population. (C) SDS-PAGE of the samples analyzed by mass spectrometry. Secreted proteins rendered a good and similar expression yield.

