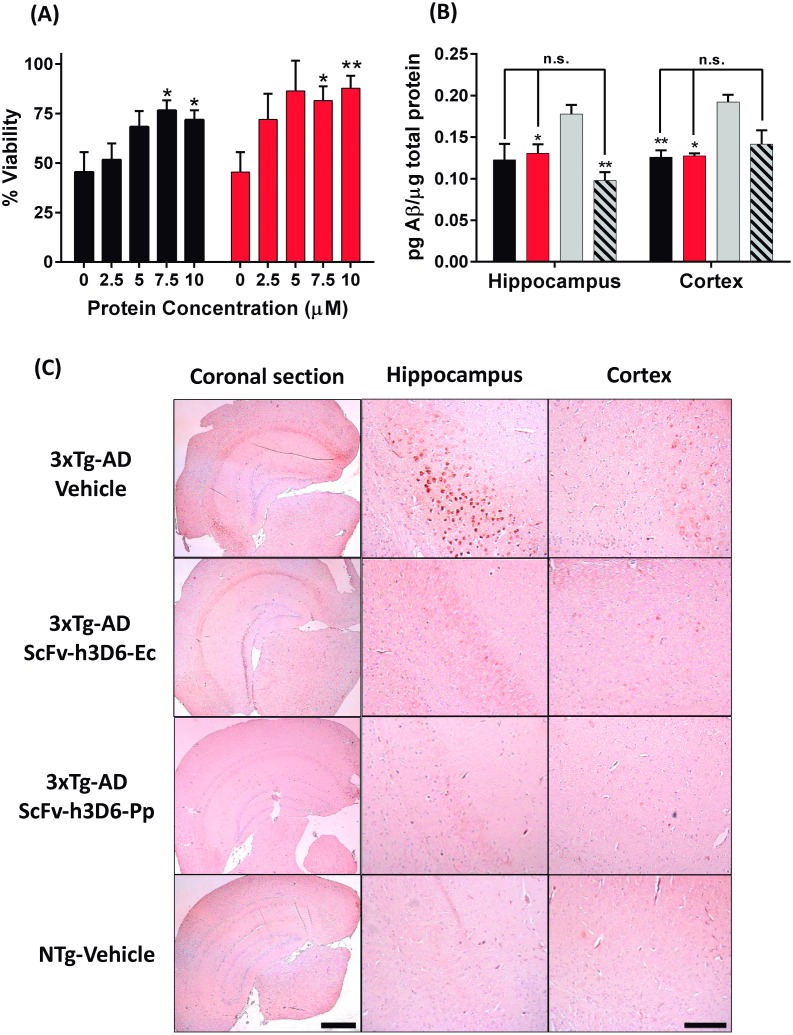
Fig 7. Therapeutic effects of scFv-hD6-Ec and scFv-h3D6-Pp.
(A) Viability assays in SH-SY5Y neuroblastoma cell line. Cells were exposed to Aβ oligomers (10 μM) and different concentrations of scFv-h3D6-Ec or scFv-h3D6-Pp. Black: scFv-h3D6-Ec, Red: scFv-h3D6-Pp. Comparisons of each concentration of scFv-h3D6-Ec or scFv-h3D6-Pp with Aβ alone showed statistical significance for 7.5 and 10 μM in both cases, indicating efficiency of both treatments (unpaired t-test with Welch’s correction, * p<0.05. **p<0.01). (B) Aβ42 ELISA of brain homogenates (Hippocampus and Cortex); Black: scFv-h3D6-Ec, Red: scFv-h3D6-Pp, Grey: 3xTg-AD-Vehicle, Stripped: NTg-vehicle. Both treatments recovered the non-pathological levels of Aβ. *, ** indicate significance compared to the 3xTg-AD-vehicle group (Unpaired t-test with Welch’s correction, *p<0.05, **p<0.01). Arrows indicate comparisons with NTg-vehicle group (n.s. indicates no significance). (C) Aβ Immunohistochemistry of coronal sections. Aβ-immunoreactivity decreased to similar levels as those in non-transgenic animals when 3xTg-AD were treated with scFv-h3D6-Ec or scFv-h3D6-Pp. Bar in panoramic coronal sections (2.5x zoom in) corresponds to 1 mm and in hippocampus and cortex sections (16x zoom in) to 200 μm.

